Multiples valuation method for stocks

Multiples valuation method for stocks

Jorge Karam Dib

In this article, Jorge KARAM DIB (ESSEC Business School, Master in Strategy and Management of International Business (SMIB), 2024-2025) introduces the method to evaluate stocks called “multiples valuation”.

How much should a stock be worth?

Valuing stocks is a complex yet essential endeavor for investors seeking to make informed decisions in the financial markets. Knowing if you are paying a fair price or if you are over or under paying for a stock is every investors question. Of course, a decision on whether investing or not in a company comes after a long due diligence of valuating the financials of the company, following their reports, and many more actions to ensure you are buying something of value. Some investors call this method “value investing”, when the investor value a stock above the actual price, it is said that the type of investing is “value”, trying to take advantage of the differential between the actual price and the theoretical price. And when they buy a stock for a competitive advantage that is not expected in the near future to concede, it is usually called “growth investing”. Although some famous investors disagree in these definitions, they are used frequently in the financial language.

While there is no one-size-fits-all approach to valuing stocks, investors often turn to a range of methodologies, one of which is multiples analysis. By examining multiples such as price-to-earnings (P/E), price-to-book (P/B), and price-to-sales (P/S), and many more, investors gain insights into how the market values a company relative to its earnings, assets, or revenue. In this article we will try to shine a light on this valuating method and walk through the benefits and limitations the method has.

Multiples valuation method

Multiples valuation method involves analyzing one or more multiples, such as the price-to-earnings (P/E), price-to-book (P/B), and price-to-sales (P/S) ratios, among others. Each multiple provides a unique perspective on how the market values a company relative to its earnings, assets, or revenue.

The price-to-earnings (P/E) ratio, for instance, compares a company’s stock price to its earnings per share (EPS), indicating how much investors are willing to pay for each dollar of earnings generated by the company. A low P/E ratio may suggest that the stock is undervalued, while a high P/E ratio could indicate overvaluation.

One key aspect of this method is that it is usually compared against the ratios of companies within the same industry. It is from the investor’s criteria to decide which filters to apply for deciding against what companies the objective should be compared with, but usually it should be on the same market, region can also be an important factor, and also the size.

There are many sources of information to consult the information from, many of them free. This platform simplifies the valuation by providing not only the information, but in some cases, the ability to connect through an API and do the consulting automatically through a query. In the next image is shown an example from Capital IQ, one of the most prestigious information sources in the financial world, about Walmart and some recommendations from the platform of similar companies in the market to facilitate the calculation.

Walmart’s comparison.
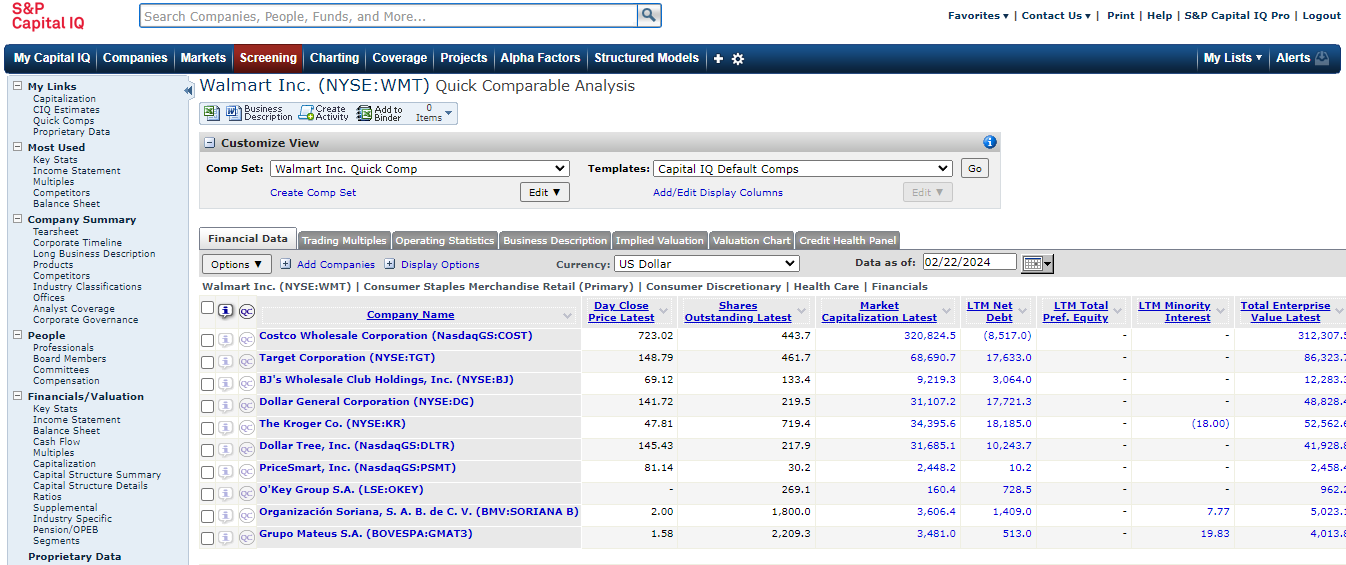
Walmart
Source: Capital IQ.

Calculations

Calculating multiples involves straightforward mathematical formulas that utilize key financial metrics derived from a company’s financial statements. If we use the case for P/E, then we would need to divide the “Market price per share” with the “Earnings per share”. After getting the ratio, let’s say of Walmart, the next step is to get the median P/E for the “similar” companies that the investor decided to compare the company with. With these two values the investor can start seeing a trend on where the company is positioned versus their competitors. The next step is to calculate the price per share of Walmart using the P/E of the similar companies, and see the comparison between the price with the original P/E versus the “mean” of similar companies.

Example: Walmart

This section will be dedicated to illustrate the method explained earlier using Walmart as an example and Capital IQ as the source of information. The first step is to consult the key financials as shown in the next picture.

Walmart’s key financials.
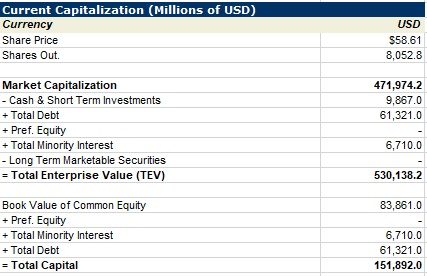
Walmart financials
Source: Capital IQ.

Next, compute the information with the comparable companies suggested by Capital IQ. Important to note that the companies can be added or withdrawn according to everyone’s own criteria.

Comparable analysis.
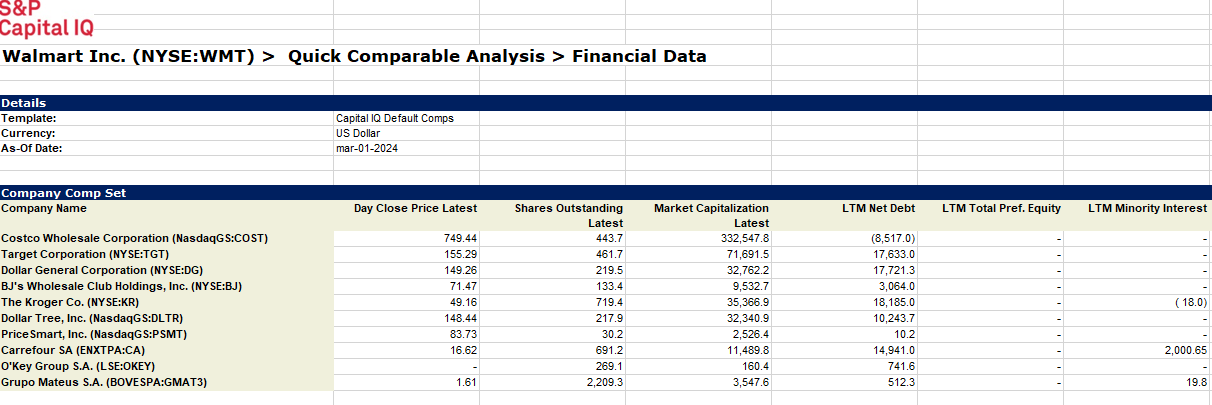
Comparable companies
Source: Capital IQ.

After retrieving all the information, the next step is to do the calculations explained earlier in the document. The mean EV/EBITDA ratio for the comparable companies and then recalculate the price of Walmart’s stock using the mean EV/EBITDA ratio.

Mean EV/EBITDA ratio.
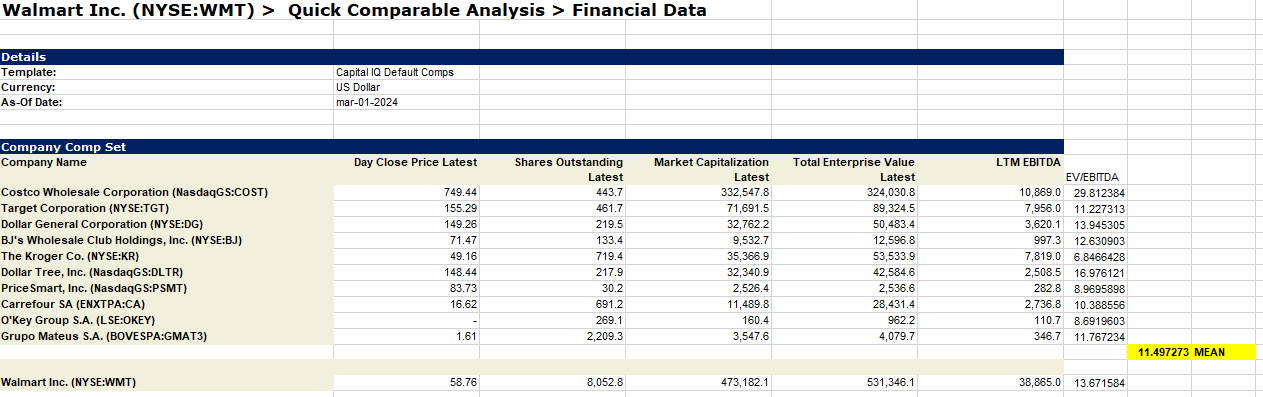
EV/EBITDA ratio
Source: Capital IQ.

Valuation of Walmart’s stock.
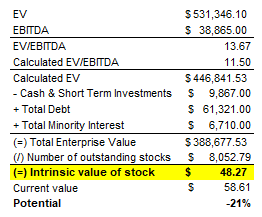
Valuation
Source: Capital IQ.

In this case, we see an underappreciation of Walmart’s stock, this doesn’t mean that anyone shouldn’t buy stocks of the company, is just the perspective of the valuation method, and also it is not an investing advice.

Conclusions

The multiples valuation method provides investors with a valuable framework for assessing the worth of a stock by comparing it to similar companies within the same industry. By using this method, investors gain insights into how the market values a company relative to its earnings, assets, or revenue.

However, it’s important to recognize the limitations of this approach. Multiples analysis relies heavily on historical financial data and may not fully capture future growth prospects or qualitative factors such as industry dynamics and competitive positioning. Additionally, multiples are subject to fluctuations in market sentiment and may not always reflect the intrinsic value of a company accurately.

Despite these limitations, multiples analysis remains a widely used and valuable tool in the arsenal of investors. When applied judiciously and supplemented with thorough research and analysis, multiples can provide valuable insights into a company’s valuation and help investors identify potential investment opportunities.

Why should I be interested in this post?

This post is with the only intention for educational purposes. Targeting people who are interested in knowing more about valuation methods for stocks. In any way this article pretends to be an investment advice and/or suggestion. Any decision should be taken under personal responsibility and with their respective due diligence previous to the decision.

Related posts on the SimTrade blog

   ▶ Ghali EL KOUHENE Asset valuation in the Real Estate sector

   ▶ Isaac ALLIALI Understanding the Gordon-Shapiro Dividend Discount Model: A Key Tool in Valuation

Useful resources

McKinsey & Company The right role for multiples in valuation

Chastenet E. and A. Marion (2015) Valuation Using Industry Multiples: How to Choose the Most Relevant Multiples, Business Valuation Review, 34(4): 173-183.

Schueler A. (2020) Valuation with Multiples: A Conceptual Analysis, Journal of Business Valuation and Economic Loss Analysis, 15(1) pp. 20190020.

About the author

The article was written in March 2024 by Jorge KARAM DIB (ESSEC Business School, Master in Strategy and Management of International Business (SMIB), 2024-2025).

Explanations for the recent changes in the Mexican economic landscape

Explanations for the recent changes in the Mexican economic landscape

Jorge Karam Dib

In this article, Jorge KARAM DIB (ESSEC Business School, Master in Strategy and Management of International Business (SMIB), 2024-2025) shares his thoughts about the different financial instruments recently available in Mexico that have been changing the economic landscape for the country and their residents in the recent years. He especially explains the role of high interest rates, new digital banks, and nonbanking financial instruments in Mexico’s recent booming economy, sharp Mexican peso appreciation, and strong increase in its GDP.

Interest rates in Mexico

For the last couple of years, the world has lived an era of high interest rates, mainly derived from the high inflation we got out of the pandemic and the war in Ukraine. Since then, the priority of most of the central banks of the world has been to cool down the economy and bring down inflation. Mexico has not been the exception. Mexico’s interest rates have been between 10% and 11% in the past three years. Some economists may consider this level -dangerously- high, but the country has seen mostly benefits like increasing peso’s appreciation, and a strong growth in the national GDP, from this level of interest rates than negative outcomes, and most important, Mexico’s government has been able to maintain the interest rates under a “controlled” level.

Evolution of Mexico’s interest rates.
Interest Rates Mexico
Source: Trading Economics.

The strategy of Mexico’s Central Bank has been very clear: to stay above the interest rates of the U.S.A. The benefits of staying above the interest of the USA’s is to target the remittances (money, mainly US Dollars, sent to Mexico, by migrant workers to their families), an objective that due the geographical conditions become very relevant. According to Statista, remittances represent a 4% of their GDP, either if it’s from migrant workers sending money to their families, or foreign investors trying to take advantage of the high interest rates in the country. “CETES” (Certificados de la Tesorerís de la Federación) is one of the most attractive instruments for foreign investments, because of the security CETES represent by being an instrument issued by the Mexican government, in the form of bonds mainly, with a return rate oscillating between 10%-12%.

CETES.
CETES
Source: S&P Dow Jones indices.

Digital Banks

There’s a recent uptrend in Latin America, but specially in Mexico of digital banks. In the last couple of years, we’ve seen multiple companies trying to gain market share, derived from the massive success of the Brazilian “unicorn” start-up Nu bank. In Mexico, the number of digital banks is starting to get closer to the traditional banks. Just in the last years, digital banks like Klar, Ualá, Hey Banco, RappiPay, among many others have entered the Mexican market with the objective to compete for market share with Nu bank.

Apart from the many benefits and functionalities that digital banks provide, better than the traditional banks, they’ve tried to attract more customers by trying to take advantage by offering the customers the possibility of investing their money inside their organization by adding a tool to their services called a “SOFIPO”, which will be explained further in the article. The return offered by each SOFIPO will depend on each institution issuing the instrument, but it will be mainly linked to the interest rate in the country. As we mentioned before, we are in a high interest rate season, which has turned into a “bidding war” for digital banks to offer better returns. As of February 2024, Nu bank offers one of the highest with 15%, Klar 14%, Hey Banco 11%, Ualá 15%.

The Mexican peso appreciated against the dollar in 2023 by 14%, reaching an eight-year low. Important to note that all these attractive financial instruments joined with a strong benefit from the world’s leading trends like nearshoring, have made Mexico become one of the best performing countries in terms of economy in the past few years and also one of the most attractive to invest in.

Mexican peso.
MXN
Source: Yahoo finance.

¿What is a SOFIPO?

Acronym for “Sociedad Financiera Popular” (Popular Financial Society), are defined as financial institutions -nonbanking- regulated by the CNBV (Comisión Nacional Bancaria y de Valores en México). They offer a wide variety of financial instruments such as personal loans, credits, financing for small companies, and more. The intention of why this instruments (SOFIPO’s) were created is mainly to open the financial services to a broader public and/or have more inclusion when it comes about investing, credits, and more.

Conclusions

There is no doubt that Mexico has a good advantage when it comes to macroeconomic trends, mainly due its geographical position. But recently, they have been able to complement the attractiveness with financial instruments and rates extremely attractive to the foreign audience and the local one. The challenge lies in keeping under control the high interest rates, even though inflation is not in double digits anymore, the benefits that the actual rates have brought to the country have been substantial, besides as the original plan is to follow with a margin the decisions of the U.S.A., there is no decision yet to bring down the rates. Not everything is positive with this financial conditions, the cost of debt in the country is very high at the moment, which will slow down the sales of houses and cars.

Why should I be interested in this post?

This post is with the intention to shine a light on potential advantages and trends that are happening in one of the most attractive countries, financially and economically speaking in the world. In any way this article pretends to be an investment advice and/or suggestion. Any decision should be taken under personal responsibility and with their respective due diligence previous to the decision.

Related posts on the SimTrade blog

   ▶ Cynthia LIN Financial products marketing in neobanks

Useful resources

Trading Economics Mexico interest rate

Mexico Business News Nonbanking financial institutions face historic opportunity

Statista Remesas en Mexico

S&P Dow Jones IndicesS&P BMV Government CETES Bond Index

El Economista Nu Mexico busca combatir el ahorro pasivo lanza oficialmente cuenta de ahorro

El Universal Guerra de tasas, Nu ofrece rendimientos de 15 en cuenta de ahorro

Mexico Business News Mexican peso appreciation 2023 affects public revenues

About the author

The article was written in March 2024 by Jorge KARAM DIB (ESSEC Business School, Master in Strategy and Management of International Business (SMIB), 2024-2025).

My experience as a Data analyst in CEMEX

My experience as a Data analyst in CEMEX

Jorge KARAM DIB

In this article, Jorge KARAM DIB (ESSEC Business School, Master in Strategy and Management of International Business (SMIB), 2024-2025) shares his professional experience as a Data Analyst and Data Management in CEMEX.

About the company

CEMEX is one of the leaders in building materials in the world. Their main products are cement, concrete, and aggregates (building materials in general). Based in Mexico, CEMEX reported a $15bn USD revenue in 2022, representing a 12% increase from the previous year. The company’s sales distribution, with cement, leading at 42%, followed by concrete at 33%, aggregates at 14%, and urban development at 11%, illustrates a balanced yet strategic emphasis on its core products and services.

Geographically, CEMEX’s influence spans major regions, with a substantial presence in Mexico, the USA, Europe, Asia, the Middle East, South America, and the Caribbean. Its operational footprint includes 64 cement plants, 1348 ready-mix concrete facilities, 246 quarries, 269 distribution centers, and 68 marine terminals, showcasing its capacity to serve a global clientele effectively.

At their beginnings, the company started with a single plant in Hidalgo, Mexico, called “Planta Hidalgo” under the direction of Mr. Lorenzo Zambrano, founder and CEO. Ever since then, the company adopted a philosophy of growing by acquisition. Great financial ratios, high volume of sales related to a big percentage of market share in Mexico, allowed CEMEX to do key strategic acquisitions throughout the next years that catapulted CEMEX into the international markets. Even with the financial crisis in 2008, they have been resilient and survived a big economic turmoil thanks to their high-quality products, service and cutting-edge advancements in digitalization, supply chain and data management.

Logo of the company
Logo of  CEMEX
Source: CEMEX.

At the beginning of my career in the company, I started inside a program called “Digital Professionals in Development” (DPiD) which aimed to train and prepare 100 recently graduates to help the company boost the digital transformation in a period where CEMEX was going through a major digital transition of the commercial customer experience. Inside the program, I started as a Data Scientist inside the Global Data Analytics department, which allowed me to understand the different schemes of work, the hierarchical processes, capabilities and scope of the company and the institutional tools.

After working for the Global Data Analytics, another area that I’ve had experience, and where I’ve spent most of my time with, is the Commercial Development Area. Here, the intention is to keep the company at the state of the art in the commercial practices and keeping up with the technological trends of the world. My main duties have been regarding Data Management, on the development and management of advanced data analytics projects and master data quality, everything under the commercial umbrella.

My expertise at Data Management

Advanced Analytics

The way Advanced Analytics topics are managed is in a scheme by projects and in a cross-functional mode with other areas of the company like data architecture, supply chain, and more. According to the needs, or trends that anyone in the company points out, we assess the feasibility and benefit of approaching a new idea.

Some of the topics that we’ve been approaching have to do with increasing sales, enhance customer experience, increase Net Promoter Score (NPS), and improve the digital experience. One of the main projects that we’ve been developing is aligned with the retention of customers by predicting with service variables, historic volume trends, and machine learning the probability of a customer leaving the company. This effort requires to align with sales people of the different regions to set thresholds for the service variables and come to an agreement, consume information from the correct architecture source, and do the development of the machine learning model. As a final product, we’ve got the model embedded in a dashboard that the sales people can consult at any time, joined by monthly alerts sent to their email and their Customer Relationship Management (CRM) account.

Data Quality

Within the area, we’re managing the quality of the commercial information by managing and implementing actions to improve their completeness and accuracy. We acknowledge the importance of a high-quality level of information. Understanding that high data quality is the base of a successful forecast, project improvements, and in general for a company to become data driven.

As expected with a company that has presence in many regions of the world, the amount of information and different types of it can be overwhelming, a prioritization and starting point had to be put in place in order to overcome the overwhelming amount of information. Naturally, the first step was to define the attributes, and fields to be measured. After doing so, we had a clear picture of pain points throughout the regions and we prioritize the remediation of them. Lastly, as we don’t want to be continuously doing the cleaning effort, we want to maintain as much as possible the incoming information clean, in order to do so, it is necessary to put entry point validations to only allow clean information to come into the systems.

Required skills and knowledge

It is necessary to have the “hard skills” to work with the institutional tools, in CEMEX’s case, it is needed to know SQL, Power Bi, and Python (and/or R). Apart from the “hard skills” just mentioned, it is also necessary for “soft skills” to be known and/or developed, which would be to coordinate different areas and teams to work together, frequent results report, presentations to stakeholders, agile methodology to follow the progress of the project, and more.

What I learned

My main takeaways that I’ve had working at these projects is the importance of coordination with other areas, the help and expertise that you can get from relying with people with more experience would be as a shortcut for a lot of problems that may arise. Always ask for help whenever you feel that you might be stuck with an issue and be open to receive new ideas.

Financial concepts related my internship

EBITDA/Debt ratio

As mentioned earlier, part of the company’s philosophy is to grow by acquisition, hence the EBITDA/Debt ratio is crucial in order to get debt with lower interest rates, as the ratio is part of the key financials that banks and rating entities take into account when analyzing a company.

Return on Assets (ROA)

This financial indicator measures a company’s efficiency in generating profits from its assets. It is calculated by dividing the company’s net income by its average total assets. In other words, ROA indicates how effectively a company is utilizing its assets to generate earnings.

Why should I be interested in this post?

This post is with the intention that any student or alumni can have a glimpse of the structure of my professional experience in a company that is based in a different continent and would probably help them compare and see the main differences and similitudes between what is being done in Europe against what is being done in Mexico.

Related posts on the SimTrade blog

   ▶ All posts about Professional experiences

   ▶ Nithisha CHALLA AML Policies: Safeguarding Financial Integrity

   ▶ Chloé ANIFRANI My experience as an Asset Management Sales Assistant for Amplegest

Useful resources

CEMEX Official webpage in France (ICD)

About the author

The article was written in March 2024 by Jorge KARAM DIB (ESSEC Business School, Master in Strategy and Management of International Business (SMIB), 2024-2025).