

In this article, Olivia BRÜN (ESSEC Business School, Global Bachelor in Business Administration (BGBA), and ESIC Business School, Bachelor of Business Administration and Management (BBAM), 2022–2026) analyses the concept of break-even analysis, a widely used financial technique employed to determine business profitability. This article illustrates the method in a case study of Watches of Switzerland Group, a publicly listed upscale watch retailer with its headquarters in the United Kingdom.
Introduction and Context
Break-even analysis is a critical component of managerial decision-making and financial planning. It allows companies to determine the level (volume) of sales that will cover all costs, both variable and fixed, before the company can be profitable. The break-even point is a crucial milestone in the operations of a firm. Sales below the break-even point create losses, while sales above it enable every extra unit sold to contribute to overall profitability.
This method is widely used in various industries to evaluate new projects, determine pricing strategies, and examine the financial feasibility of corporate decisions. Especially in capital-intensive industries or businesses focused on product offerings, understanding the break-even point is key to sound financial management and setting realistic sales targets.
History of the Concept
Break-even analysis stems from cost-volume-profit (CVP) analysis. Originating in managerial accounting in the early 20th century, CVP distinguishes between fixed costs (independent of production volume) and variable costs (dependent on production volume). By comparing these costs to projected revenues, decision-makers can identify the break-even point.
Case Study: Watches of Switzerland Group
This case study applies the break-even method to Watches of Switzerland Group PLC, a retailer of high-end watches. The following figures are taken from the company’s 2022 Annual Report:
For full financial details, see the official Watches Annual Report (2022).
Using these values, we compute the variable cost per unit and contribution margin per unit as follows:
- Variable cost per unit: £3,132 (= £966.5 million / 308,560)
- Contribution margin per unit: £1,868 (= £5,000 – £3,132 )
Break-even point (units): 220,128 units (= Fixed Costs / Contribution Margin per Unit = £411.2 million / £1,868).
At the break-even point, total revenues and total costs are approximately £1.1 billion. Sales above this point generate operating profit.
Break-even Chart from Excel
The chart below illustrates the relationship between total revenue and total cost across different sales volumes. The break-even point is located where the two lines intersect, at approximately 220,128 units, equivalent to around £1.1 billion in revenue. This marks the threshold at which the company covers all fixed and variable costs, resulting in neither profit nor loss.
The underlying Excel model (see “READ ME” tab for detailed explanations) allows for interactive analysis. Users can adjust inputs such as fixed costs, average selling price, and variable cost per unit. The break-even point updates automatically, making the tool highly practical for scenario analysis and financial planning. This kind of sensitivity analysis is essential in real world decision making, especially in industries with high fixed costs like luxury retail.
Break-even Analysis for Watches of Switzerland Group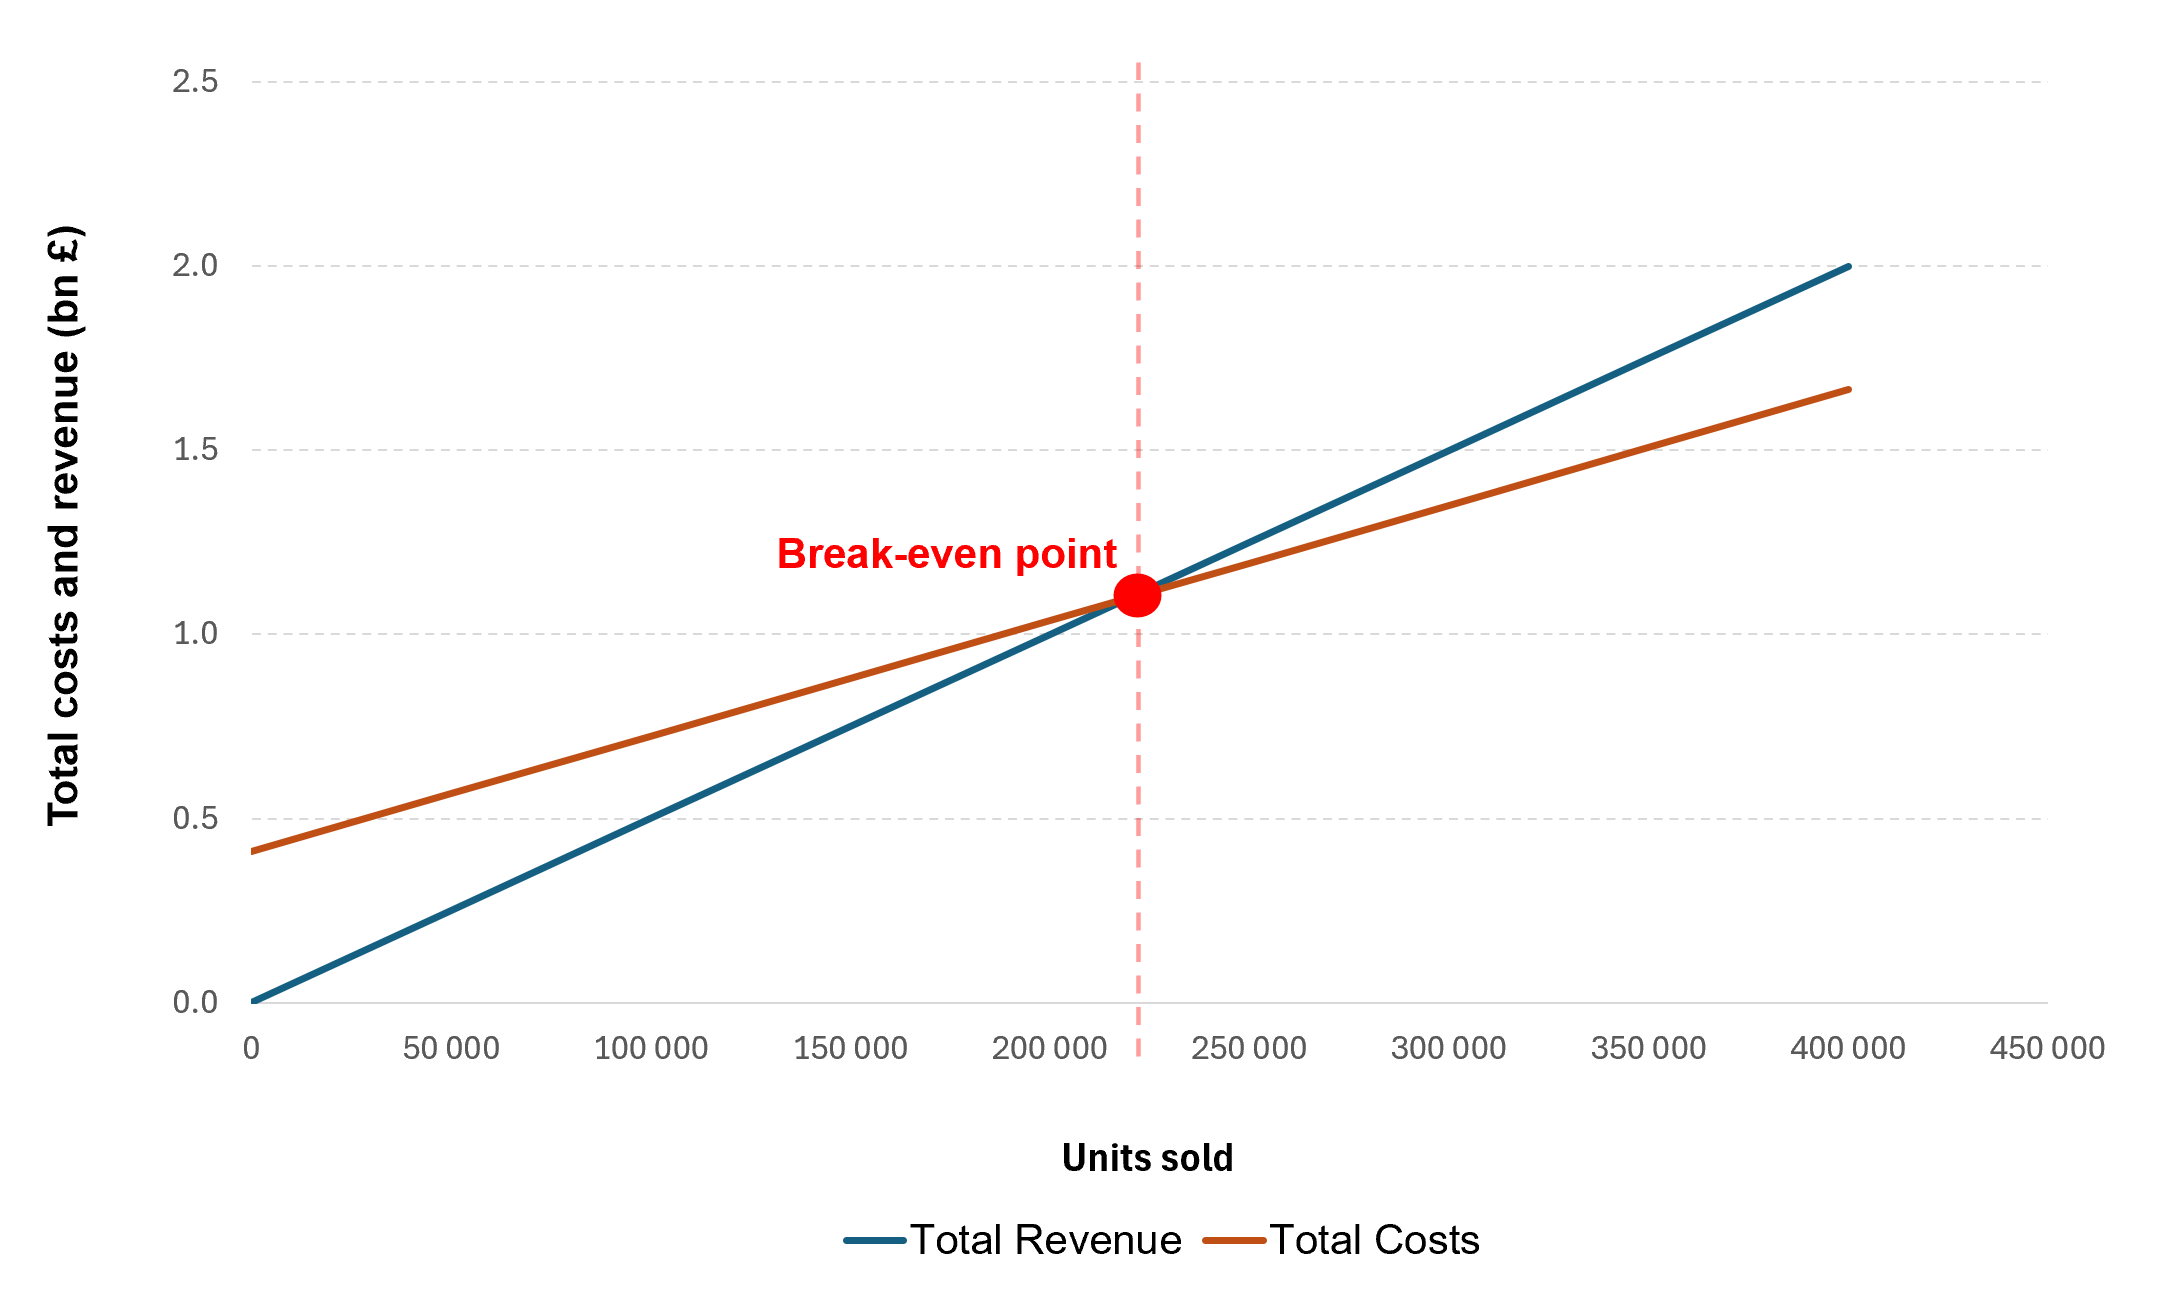
Source: Excel computation based on data from Watches of Switzerland Group
You may download the Excel file used to do the computations and produce the chart above.

Why should I be interested in this post?
Break-even analysis is fundamental in both theoretical and applied finance. It is widely used in consultancy, financial planning, and entrepreneurship. Understanding this concept allows business professionals to assess cost structures, pricing strategies, and financial viability of new projects.
For an ESSEC student pursuing business or finance, mastering break-even analysis equips you to analyze operational leverage and forecast how profits change with varying sales levels. This insight helps in making informed strategic decisions, managing risk, and ensuring sustainable business growth.
Useful resources
Academic resources
Horngren, C. T., Datar, S. M., & Rajan, M. V. (2015) Cost Accounting: A Managerial Emphasis (15th ed.). Pearson Education. – This foundational textbook offers detailed explanations of break-even analysis, cost behavior, and their relevance in managerial decision-making.
Atrill, P., McLaney, E. (2022) Management Accounting for Decision Makers (10th ed.). Pearson.
– This book focuses on applying break-even and contribution analysis in real business contexts, helping students and professionals make informed financial decisions.
Gallo, A. (2014) A Quick Guide to Breakeven Analysis Harvard Business Review.
Business resources
Watches of Switzerland Group (2022) Annual Report and Accounts 2022
About the author
The article was written in May 2025 by Olivia BRÜN (ESSEC Business School, Global Bachelor in Business Administration (BGBA), and ESIC Business School, Bachelor of Business Administration and Management (BBAM), 2022–2026), 2022–2026).