In this article, Ian DI MUZIO (ESSEC Business School, Master in Finance, 2025–2027) examines how investment banks structure consideration in M&A deals through earn-outs, rollover equity, and other forms of contingent consideration, and how these tools redistribute risk and return between buyer and seller.
Context and objective
In most introductory valuation courses, M&A is presented as if deals were paid in a single block of cash at closing, with maybe some stock mixed in. In practice, especially for private targets, the consideration structure can be highly engineered: part cash, part vendor rollover, part earn-out, sometimes with ratchets, performance-based options, or contingent value rights. These instruments are not cosmetic. They shift economic exposure to future performance, mitigate information asymmetry, and can literally decide whether a deal is financeable and acceptable to both sides.
The objective of this article is to provide a practical, technical lens on deal structuring from an investment banking perspective. We will:
- Define earn-outs, rollover equity, and other forms of contingent consideration.
- Explain how they affect valuation, incentives, and risk allocation between buyer and seller.
- Show, via simple numerical illustrations, how these structures change internal rate of return (IRR) profiles and downside protection.
- Discuss how investment banks help clients choose among structures, negotiate terms, and document them.
The target reader is a student or junior analyst who already understands basic discounted cash-flow (DCF) analysis and valuation multiples (e.g., EV/EBITDA) and wants to see how real‑world M&A uses structuring to solve problems that pure valuation cannot.
Why should I be interested in this post?
For ESSEC students targeting investment banking or private equity, deal structuring is one of the clearest markers of “on-the-job” knowledge. Many candidates can explain EV/EBITDA; far fewer can articulate when you would propose an earn-out instead of a price cut, how much rollover equity is typical in sponsor-backed deals, or how contingent payments are discounted and recorded.
Understanding these tools matters for three reasons:
- Interviews: Questions on earn-outs and vendor rollover appear frequently in technical and case interviews. Being able to speak in terms of incentives and risk, not just definitions, differentiates you.
- Live work: As a junior in M&A, you will build models where 10–40% of consideration is contingent. Mis-modelling that leg can distort valuation, internal rate of return (IRR), and leverage metrics.
- Client dialogue: CEOs and founders often care more about earn-out mechanics, governance, and downside protection than about abstract DCF outputs. Structuring is where banking becomes advisory, not just arithmetic.
Earn-outs – pricing uncertainty with contingent payments
An earn-out is a contractual arrangement where part of the purchase price is paid in the future if the target achieves predefined performance metrics (such as revenue, EBITDA, or users) over a measurement period. Economically, it converts part of the fixed price into a state-contingent claim on future outcomes.
Suppose a buyer and seller disagree on the sustainable EBITDA level. The seller believes the business can reach EUR 20m of EBITDA in three years; the buyer is only comfortable underwriting EUR 15m. An earn-out can bridge this gap by paying a base purchase price consistent with EUR 15m, plus a contingent payment if actual EBITDA falls within (or above) a specified range.
From a valuation perspective, the earn-out has three key components:
- Performance metric and definition (EBITDA, revenue, gross profit; GAAP vs adjusted; FX treatment).
- Pay-out function mapping metric values to consideration (for example, linear, step, or capped).
- Discounting and probability-weighting of future pay-outs to compute present value.
The payout curve below shows that earnout payments rise as EBITDA improves, with a floor below the threshold and a cap beyond which additional performance does not yield further payment.
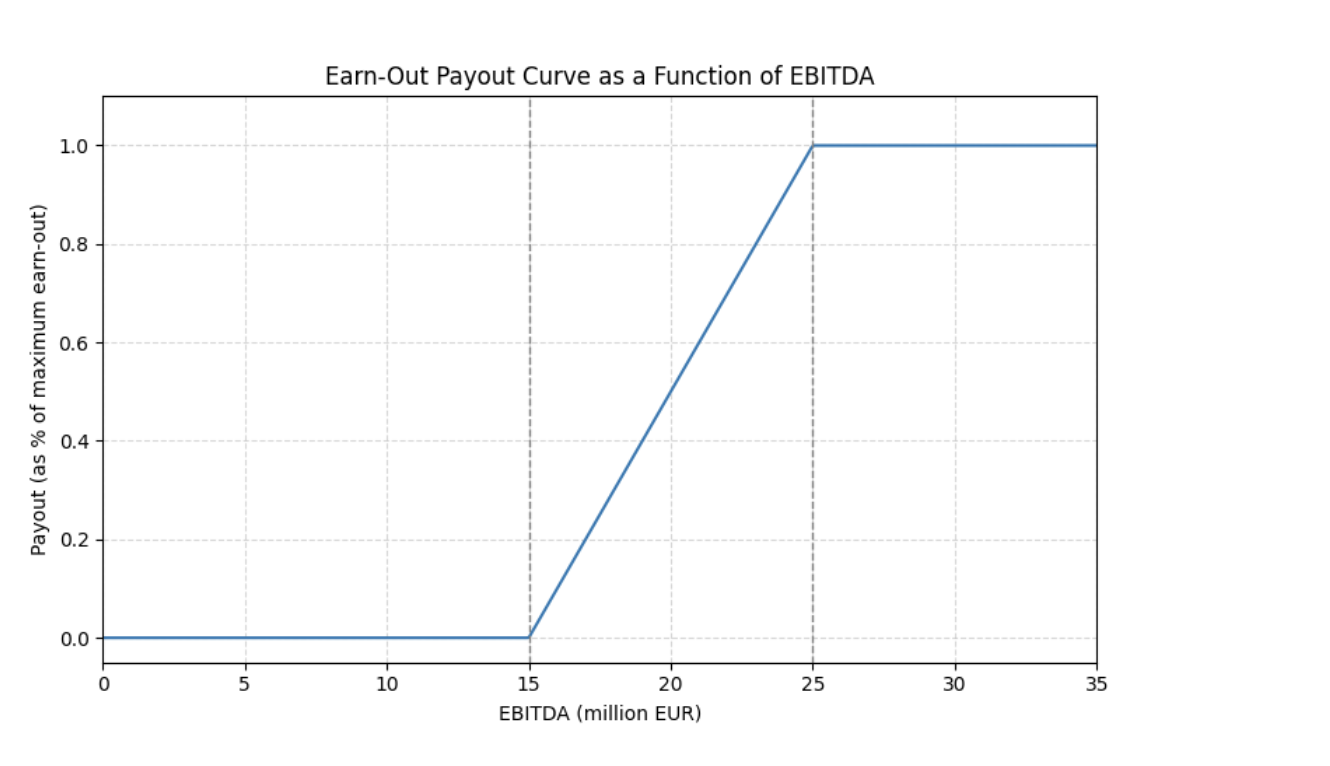
As Figure 1 illustrates, the earn-out can be seen as a call option written by the buyer on the future performance of the business. The seller receives upside if results exceed the base case, but bears downside if performance disappoints. For the buyer, this reduces the risk of overpaying based on optimistic projections and aligns seller incentives to support post-closing integration and growth.
In practice, the main challenges with earn-outs are not mathematical but behavioural and legal: defining metrics that cannot be easily manipulated, setting governance rules (who controls capex, pricing, hiring), and designing mechanisms for dispute resolution. Investment banks help by modelling multiple scenarios, benchmarking structures to market practice, and ensuring that legal drafting matches the economics in the spreadsheet.
Rollover equity – keeping the seller in the game
Rollover equity refers to the portion of the seller’s equity that is not sold for cash at closing, but reinvested into the new capital structure. In sponsor-backed deals, it is common for founders and management to roll over 20–40% of their pre-deal ownership. The rationale is twofold:
- The buyer reduces the immediate cash outlay and increases alignment: the seller remains exposed to future value creation.
- The seller keeps a “second bite of the apple”: if the PE fund executes its value-creation plan, rolled equity may be sold at a higher multiple at exit.
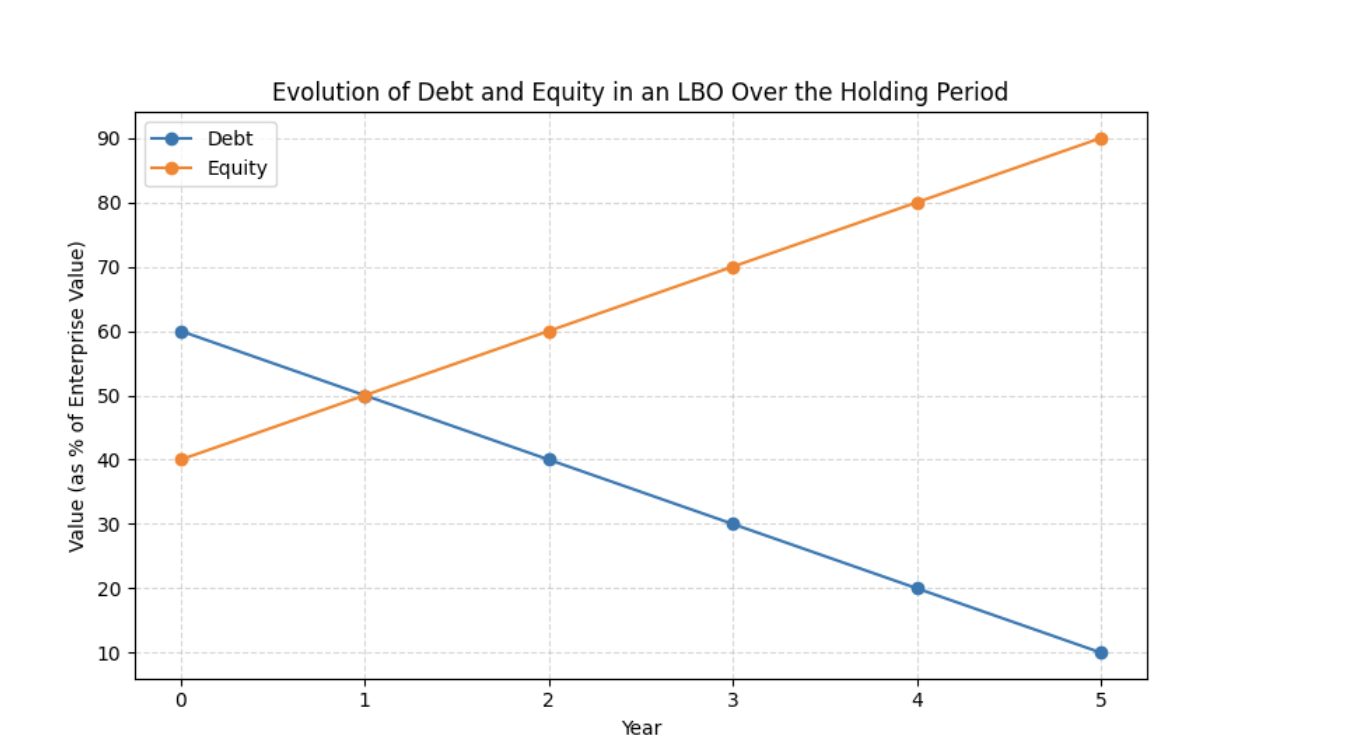
From a modelling standpoint, rollover equity affects both valuation and IRR attribution. Consider a deal where the implied enterprise value is EUR 200m, funded by EUR 120m of debt, EUR 50m of new equity from the sponsor, and EUR 30m of seller rollover. If the business is later sold for EUR 300m, the allocation of proceeds between sponsor and seller depends on their respective equity stakes and any preferred or ratchet instruments.
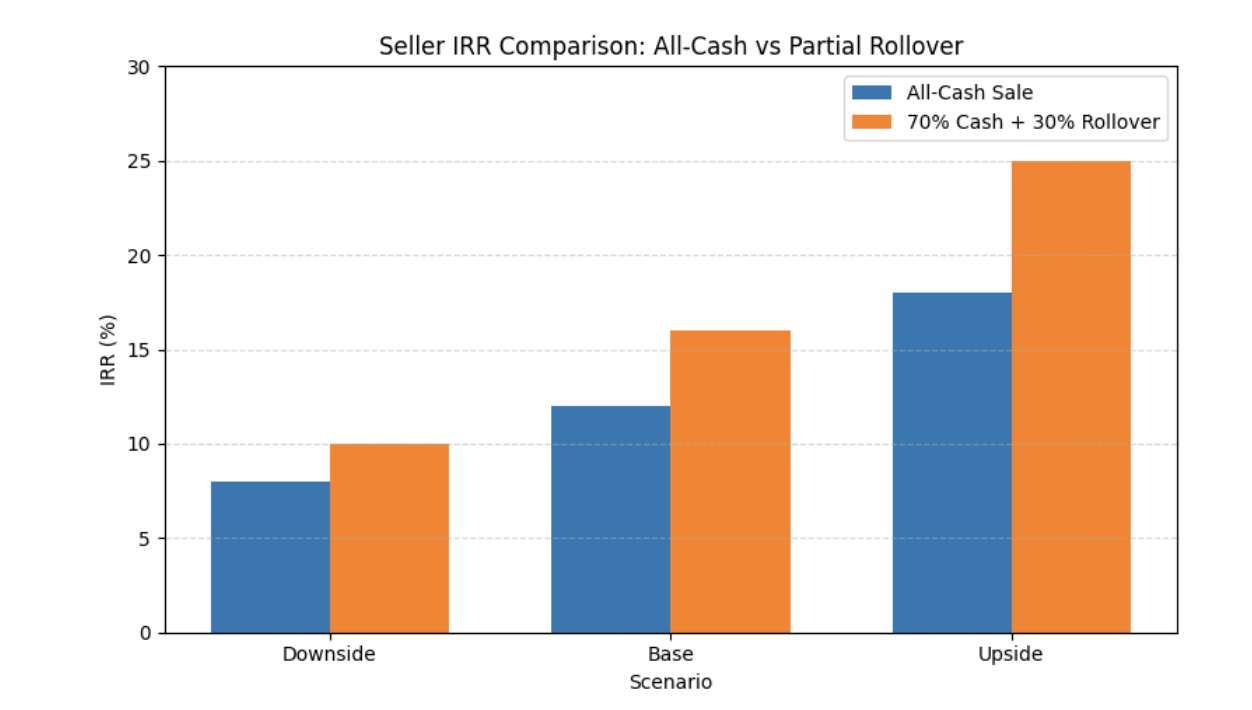
As Figure 2 suggests, for sellers who believe in the buyer’s ability to grow the business, accepting rollover can increase expected IRR, even though it reduces immediate liquidity. For buyers, requiring some rollover is a signalling device: if the seller refuses to keep any skin in the game, that may indicate scepticism about the forecast.
Investment banks advising the seller will therefore frame the decision not just in terms of headline price, but in terms of risk-adjusted value and liquidity preferences. For founder-led companies, personal risk tolerance and diversification needs matter as much as expected uplift.
Contingent consideration in the valuation model
From the perspective of a valuation or LBO model, contingent consideration (earn-outs, contingent value rights (CVRs), deferred payments with performance triggers) must be integrated explicitly into the cash-flow profile for both parties. Conceptually, you proceed in three steps:
- Define states of the world (for example, downside, base, upside) with associated performance metrics (EBITDA, revenue, net promoter score (NPS)).
- Apply the contractual pay-out function to each state to compute the contingent leg of consideration.
- Probability-weight and discount each state back to closing, using a discount rate consistent with the risk of the contingent claim (typically higher than the buyer’s WACC).
On the buyer’s side, the expected cost of contingent consideration affects both sources & uses at closing and post-deal leverage metrics. On the seller’s side, it determines expected proceeds and IRR, but with higher dispersion than a pure cash deal.
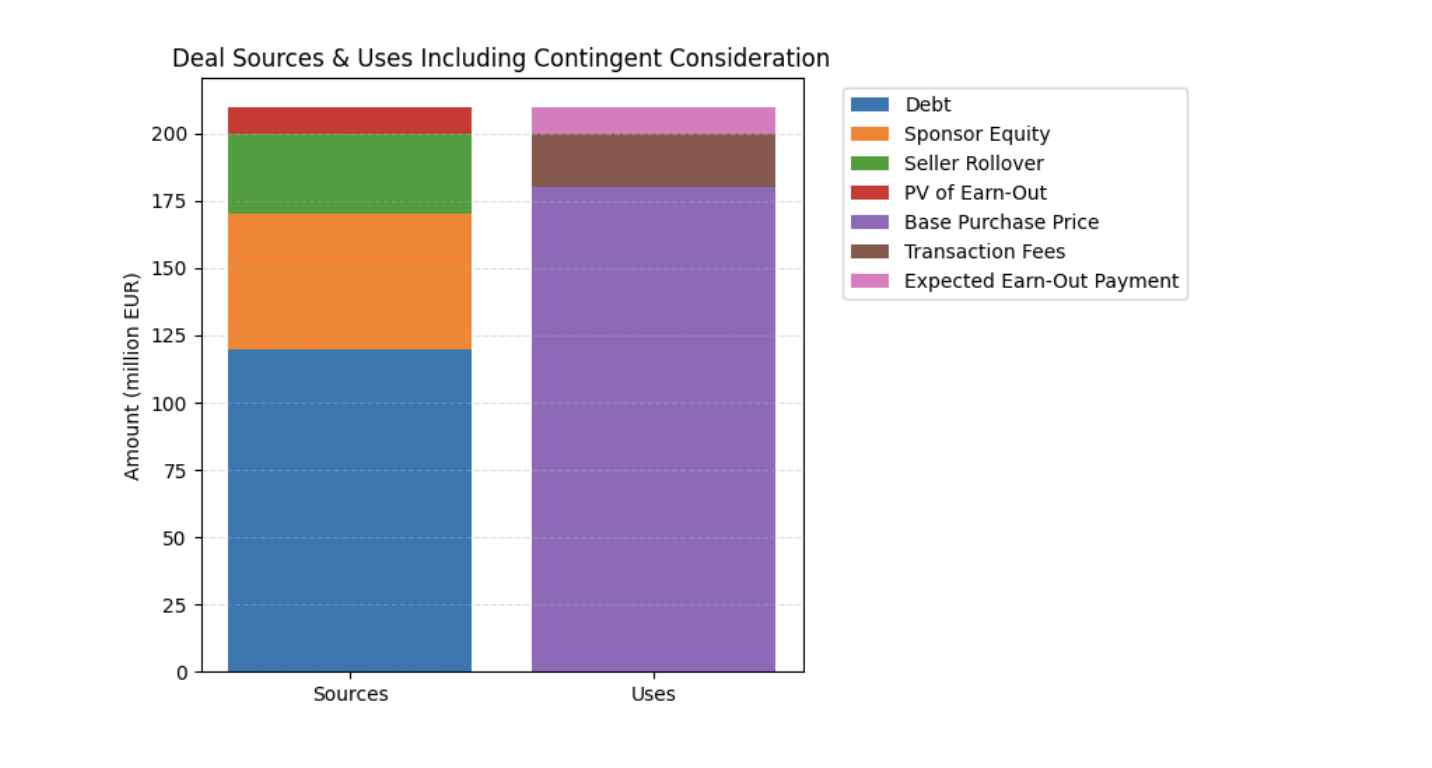
Figure 3 shows a stylized sources & uses table where the base cash consideration is funded at closing, while the expected value of the earn-out is treated as an off-balance-sheet liability that will be funded over time from cash flows. Modelers must decide whether to treat this as debt-like (affecting leverage) or equity-like (affecting valuation but not covenants), depending on accounting treatment and negotiation.
How investment banks use these tools in practice
In live mandates, investment banks use structuring levers to solve concrete constraints:
- Bridging valuation gaps: Earn-outs and seller notes allow deals to clear when buyer and seller have different expectations about growth or margin expansion.
- Managing financing constraints: Deferring part of consideration via contingent payments can make a deal financeable within leverage limits and rating constraints.
- Aligning incentives: Rollover equity and performance-based instruments keep key management motivated post-closing.
- Signalling and negotiation: Willingness to accept rollover or contingent pay-outs signals confidence in the business to the other party and to co-investors.
On the execution side, junior bankers support this by:
- Building flexible models where earn-out parameters, rollover percentages, and discount rates can be sensitized.
- Preparing deal decks that show IRR profiles and downside cases across alternative structures.
- Coordinating with legal counsel so that the SPA drafting matches the model (definitions of EBITDA, caps, floors, baskets, dispute mechanisms).
The key mindset shift is that price and structure are not independent. A buyer can pay more headline value if a larger share of that value is contingent. A seller can accept a lower base price if the earn-out and rollover offer enough upside. Good bankers are those who can use these levers to construct an efficient trade that both sides can sign.
Related posts on the SimTrade blog
▶ Emanuele BAROLI Interest Rates and M&A: How Market Dynamics Shift When Rates Rise or Fall
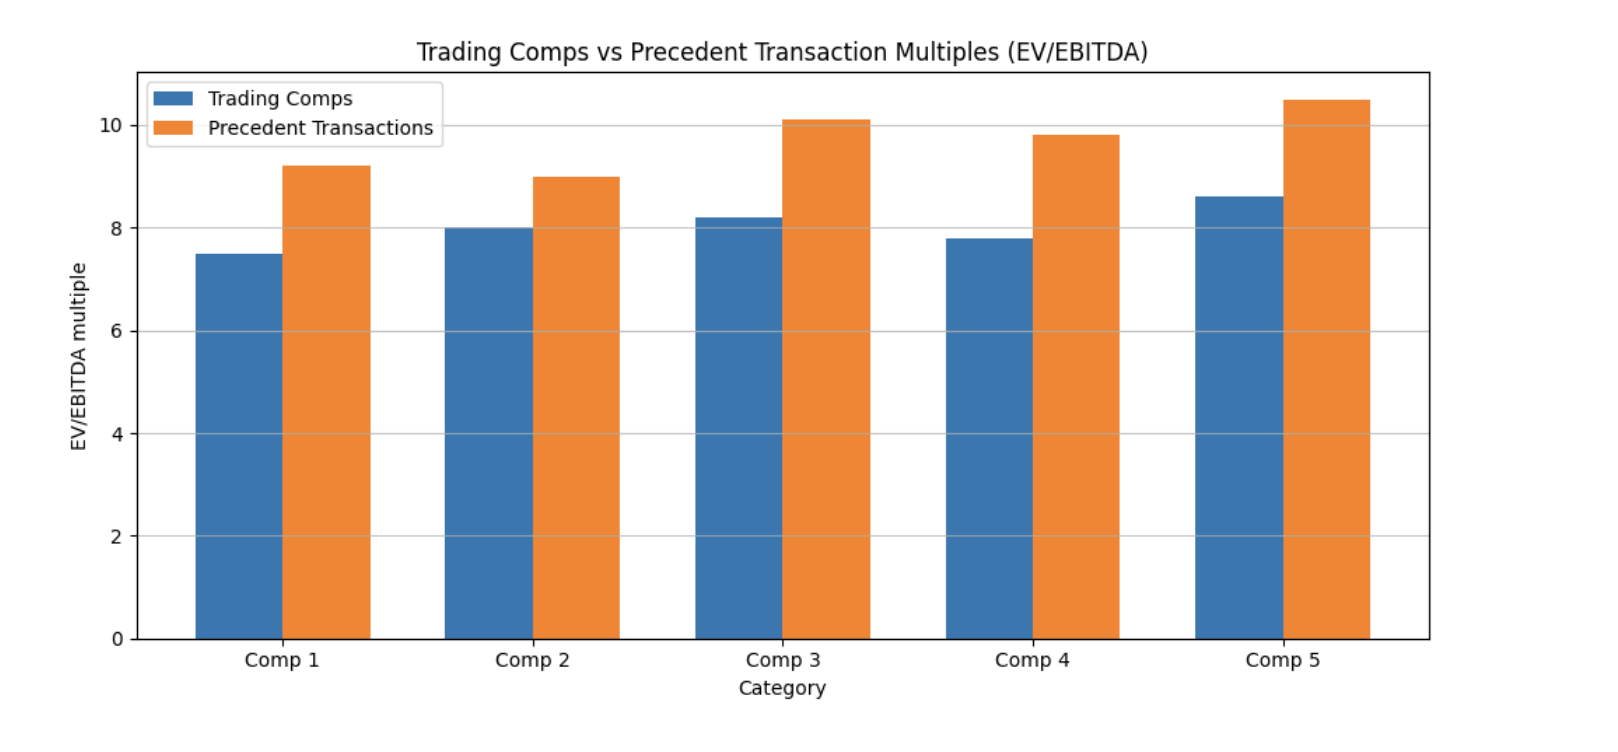
▶ Ian DI MUZIO Valuation in Niche Sectors: Using Trading Comps and Precedent Transactions When No Perfect Peers Exist
▶ Roberto RESTELLI My Internship at Valori Asset Management
Useful resources
American Bar Association (2010) Model Stock Purchase Agreement – commentary on earn-out provisions and contingent consideration, Second Edition.
American Bar Association (2010) Model Stock Purchase Agreement – commentary on earn-out provisions and contingent consideration, Second Edition.
Koller, T., Goedhart, M., & Wessels, D. (2020) Valuation: Measuring and Managing the Value of Companies (7th edition). Hoboken, NJ: John Wiley & Sons.
McKinsey & Company (2025) Valuation: Measuring and Managing the Value of Companies 8th Edition, Wiley.
Rosenbaum, J., & Pearl, J. (2021) Investment Banking: Valuation, Leveraged Buyouts, and Mergers & Acquisitions (chapters on the M&A process and deal structuring).
Taleb, N. N. (2018) Skin in the Game: Hidden Asymmetries in Daily Life, Random House Publishing Group.
About the author
The article was written in January 2026 by Ian DI MUZIO (ESSEC Business School, Master in Finance (MiF), 2025–2027).
▶ Read all posts written by Ian DI MUZIO