

In this article, Anant JAIN (ESSEC Business School, Grande Ecole Program – Master in Management, 2019-2022) introduces the economic concept of price elasticity of demand.
Introduction
Price elasticity of demand (PED) is an important economic concept that measures the impact on the demand of a product or service due to change in the price of that product or service. This concept helps businesses, policymakers, and economists make informed decisions regarding pricing strategies, economic policies, and market analysis.
Definition
Price elasticity of demand measures the degree of change in the quantity demanded of a product or service due to change in the price.
This ratio reveals the extent to which demand for a product shift in response to price changes. For instance, if a product’s price increases by 10% and the quantity demanded decreases by 20%, the PED would be: -20%/10% = -2
The negative value indicates an inverse relationship between price and demand, consistent with the law of demand i.e. if the price of the product increases, then the demand would decrease and vice versa.
Different Methodologies Of Calculating Price Elasticity Of Demand
Point Method
The point method is more precise method than the percentage method because it calculates price elasticity of a demand curve at a specific point. It includes dividing the change in quantity demanded by the price change at a given price and quantity level. This method’s formula is:
Price elasticity = (change in quantity demanded) / (change in price) * (average price / average quantity)
Example:
A shoe retailer notes that when the price of a specific sneaker increases from $60 to $70, the quantity demanded decreases from 200 to 150 sneakers.
Calculation of Price Elasticity:
Change in quantity demanded:
150−200=−50150 – 200 = -50150−200=−50
Change in price:
70−60=1070 – 60 = 1070−60=10
Average price:
(60+70)/2=65(60 + 70) / 2 = 65(60+70)/2=65
Average quantity:
(200+150)/2=175(200 + 150) / 2 = 175(200+150)/2=175
Price Elasticity:
(−50/10)∗(65/175)=−1.86( -50 / 10 ) * ( 65 / 175 ) = -1.86(−50/10)∗(65/175)=−1.86
This example shows that the demand for the sneakers is elastic since the elasticity is greater than 1.
Arc Method
The arc method is used when there is a significant change in the price or quantity demanded between any two points on the demand curve. It is calculated by dividing the change in quantity demanded by the average of the initial and final prices and then dividing that result by the change in price divided by that average. This method’s formula is:
Price elasticity = (change in quantity demanded / average quantity) / (change in price / average price)
Example:
A airline company raises the price of its ticket from $800 to $1,000, resulting in a drop in quantity demanded from 5,000 units to 3,500 tickets.
Calculation of Price Elasticity:
Change in quantity demanded:
3,500−5,000=−1,5003,500 – 5,000 = -1,5003,500−5,000=−1,500
Average quantity:
(5,000+3,500)/2=4,250(5,000 + 3,500) / 2 = 4,250(5,000+3,500)/2=4,250
Change in price:
1,000−800=2001,000 – 800 = 2001,000−800=200
Average price:
(800+1,000)/2=900(800 + 1,000) / 2 = 900(800+1,000)/2=900
Price Elasticity:
(−1,500/4,250)/(200/900)=−1.88\left( -1,500 / 4,250 \right) / \left( 200 / 900 \right) = -1.88(−1,500/4,250)/(200/900)=−1.88
This example shows that the demand for the tickets is elastic.
Types Of Price Elasticity
Elastic Demand (PED > 1)
- Definition: An elastic demand is where demand is highly responsive to price changes. A percentage change in price results in a higher percentage change in the quantity demanded of the product.
- Examples: Non-essential luxury goods such as high-end electronics or designer clothing.
- Implications: Businesses may lower prices to boost sales volumes, potentially increasing total revenue.
- Demand Curve: As shown in Figure 1, when the price decrease from 60 to 50 i.e., 17% decrease in price, the demand increases from 70 to 100 i.e., demand increases by 42%. Therefore, a slight percentage increase in price results in greater percentage increase in the quantity demanded of the good or service. As a result, the demand curve slope is flatter and we get the price elasticity as 42%/-17% = -2.47.
Figure 1. Elastic Demand Curve.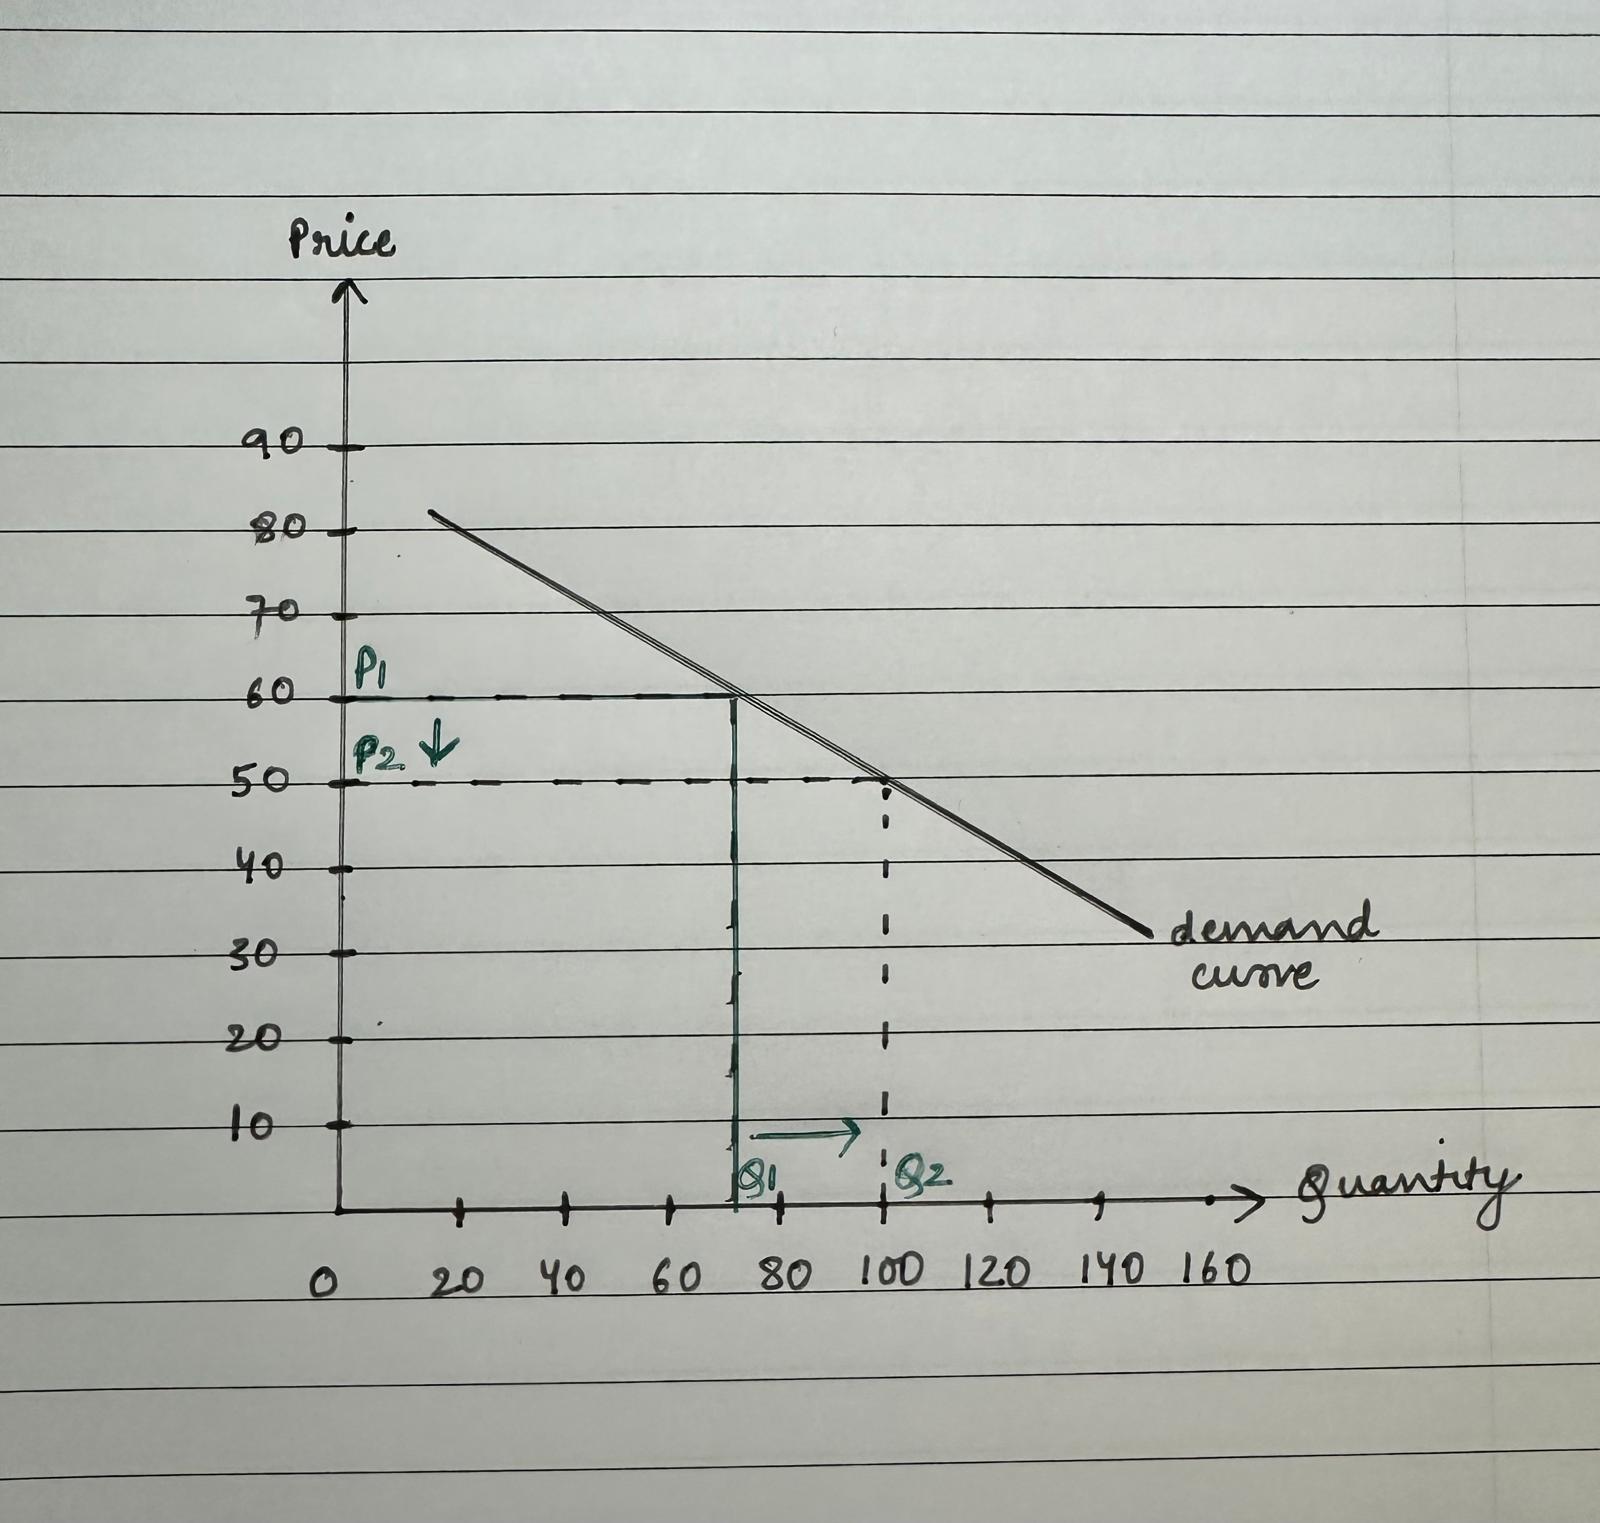
Inelastic Demand (PED < 1)
- Definition: An inelastic demand is where demand is less responsive to price changes. Price increases or decreases have a relatively small effect on the quantity demanded.
- Examples: Essential goods such as basic food items or essential medicines.
- Implications: Companies can raise prices with minimal impact on sales volume, which can enhance revenue and profit margins.
- Demand Curve: As shown in Figure 2, when the price increases from 50 to 70 i.e., 40% increase in price, the demand decreases from 80 to 70 i.e., demand decreases by 12%. Therefore, a slight percentage increase in price results in greater percentage decrease in the quantity demanded of the good or service. As a result, the demand curve slope is stepper and we get the price elasticity as -12%/40% = -0.3.
Figure 2. Inelastic Demand Curve.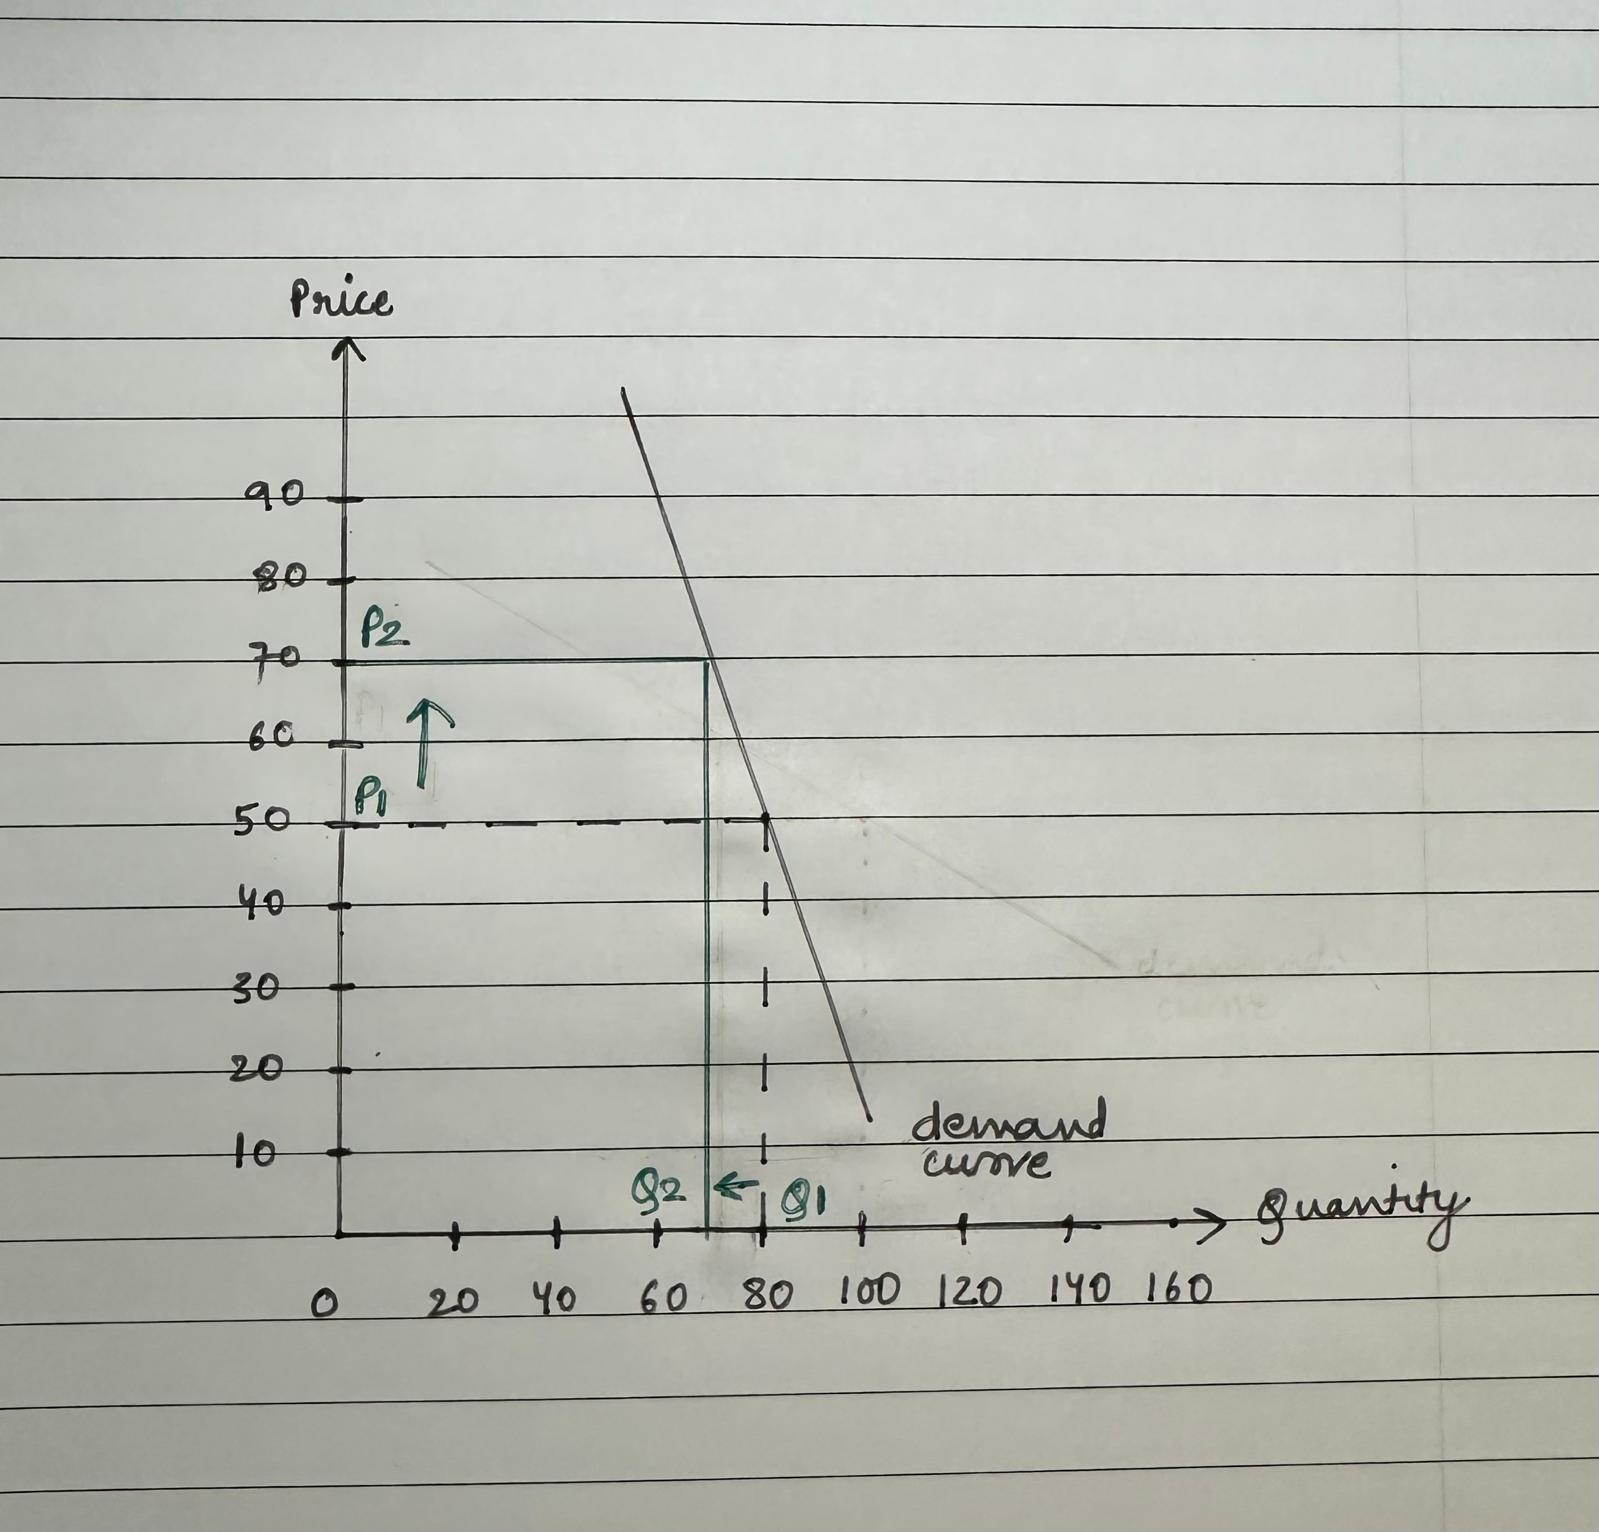
Unitary Elasticity (PED = 1)
- Definition: The percentage change in quantity demanded of a product match to the percentage change in price i.e., total revenue remains constant.
- Implications: Price adjustments need to be carefully managed to avoid altering total revenue.
- Demand Curve: As shown in Figure 3, when the price increases from 20 to 30 i.e., 50% increase in price, the demand decreases from 160 to 80 i.e., demand decreases by 50%. Therefore, a slight percentage increase in price results in an equal percentage decrease in the quantity demanded of the good or service. As a result, the price elasticity of demand is -50%/50% = -1.
Figure 3. Unitary Elastic Demand Curve.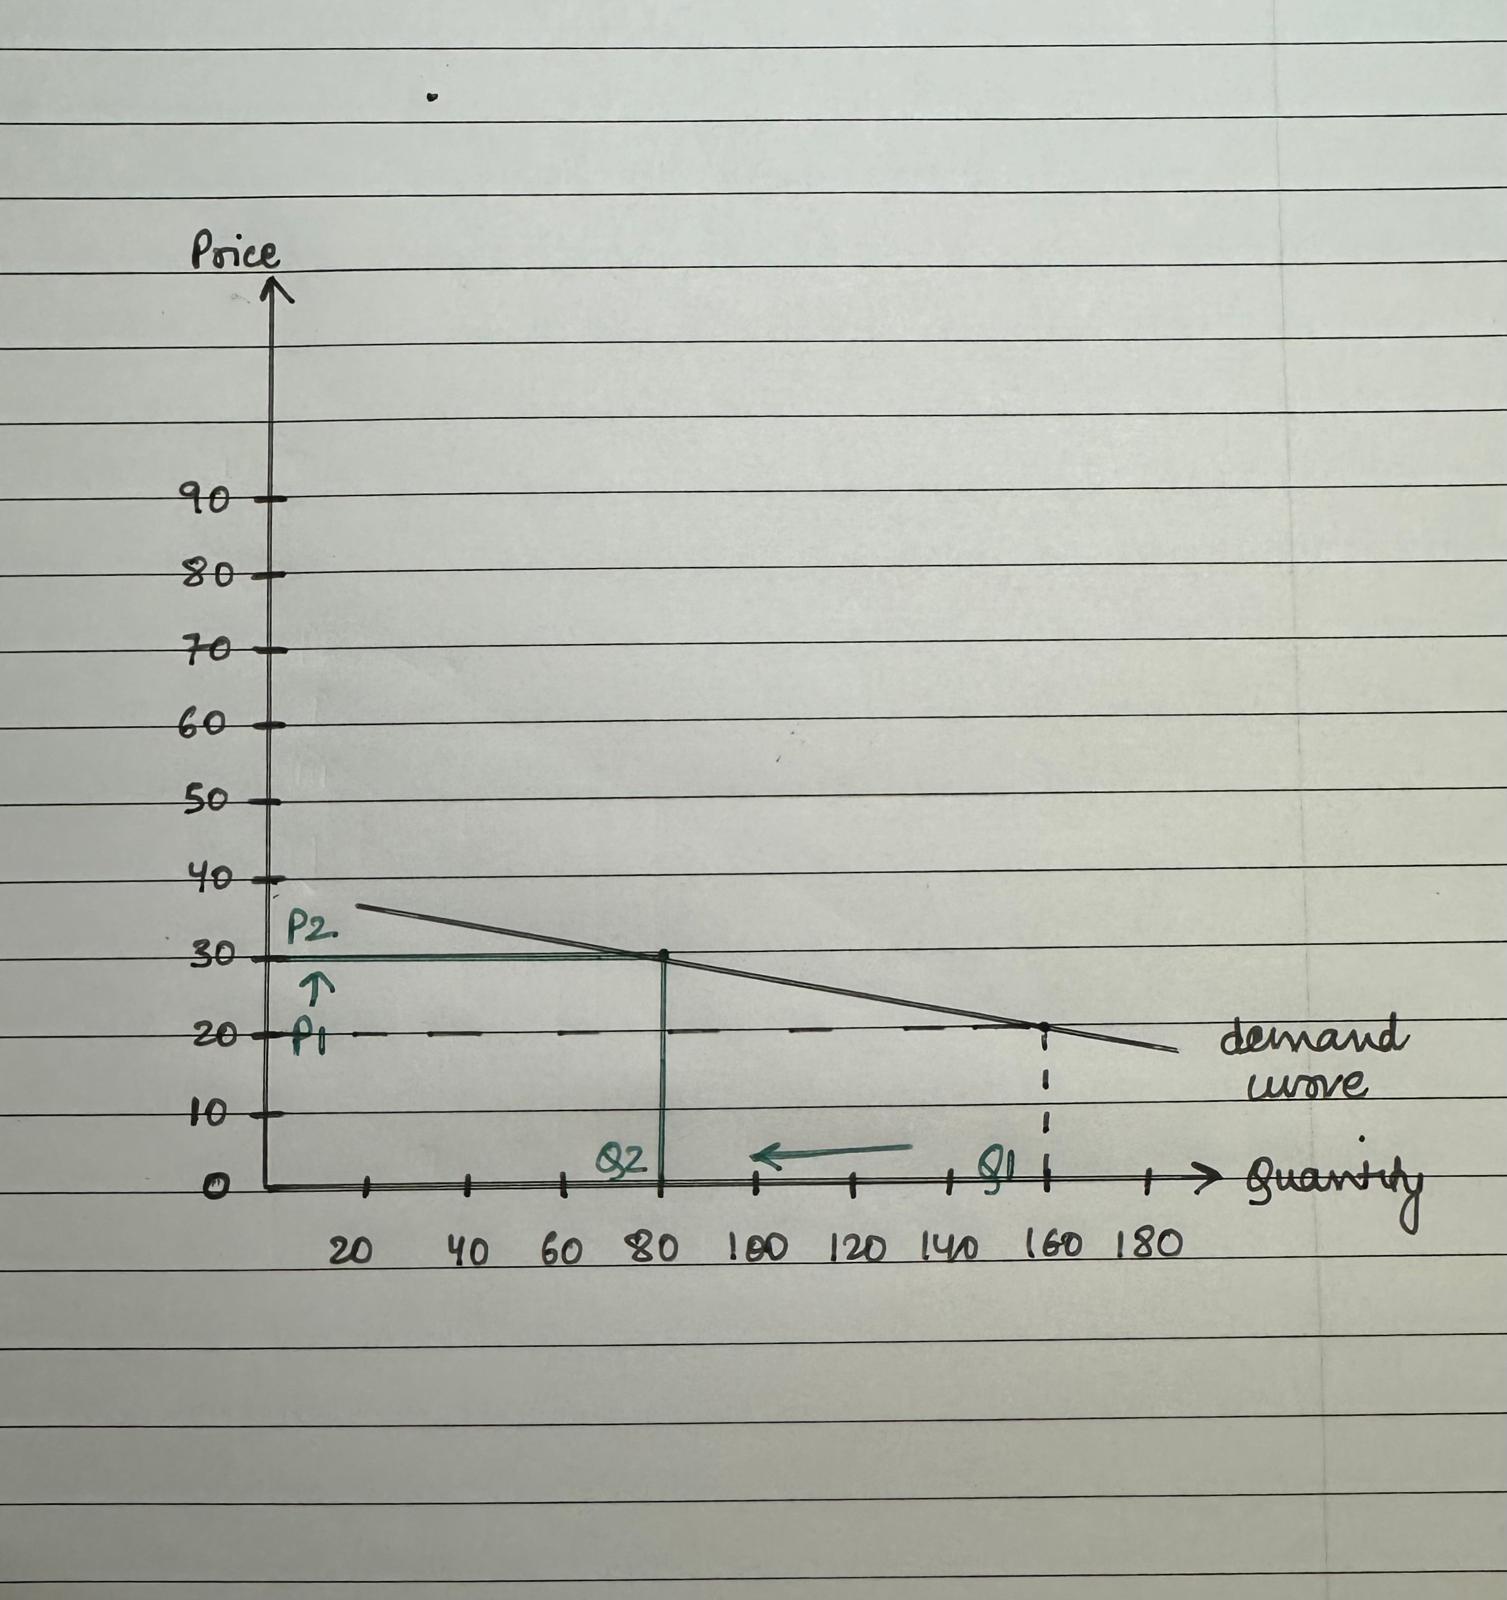
Perfectly Elastic Demand (PED = ∞)
Consumers are only willing to buy at a specific price only; any change from this price will result in no demand for the product. This is a more hypothetical case and would not ideally occur in the real world.
As shown in Figure 4, the price is fixed at 50 and the quantity demanded can increase or decrease at this price only. As soon as the price is changed, the demand would become zero. As a result, the demand curve slope is parallel to the X axis and our price elasticity is equal ∞.
Figure 4. Perfectly Elastic Demand Curve.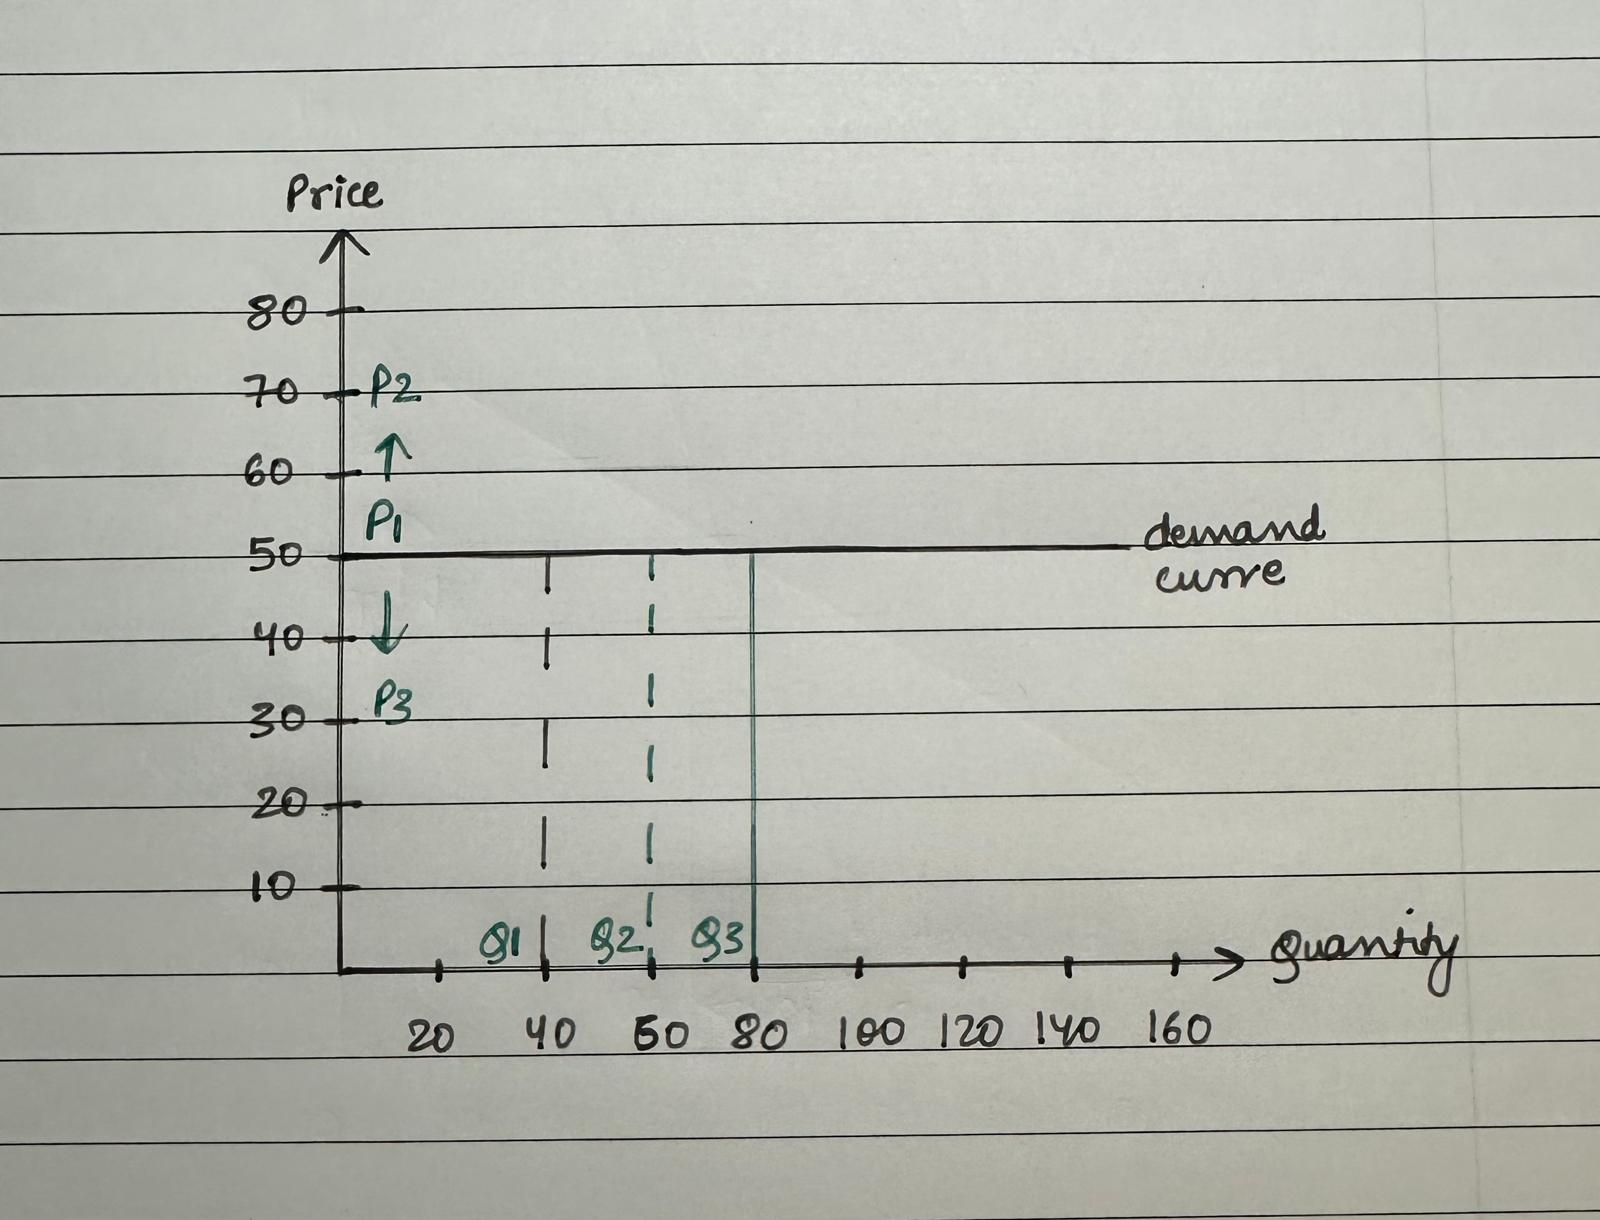
Perfectly Inelastic Demand (PED = 0)
The quantity demanded of a product will not change irrespective of the change in the price of that product. This is a more hypothetical case and would not ideally occur in the real world.
As shown in Figure 5, the quantity is fixed at 80. Any change in price will make the demand remain at the same level at all times. As a result, the demand curve slope is parallel to the Y axis and our price elasticity is 0/ % change in price = 0.
Figure 5. Perfectly Inelastic Demand Curve.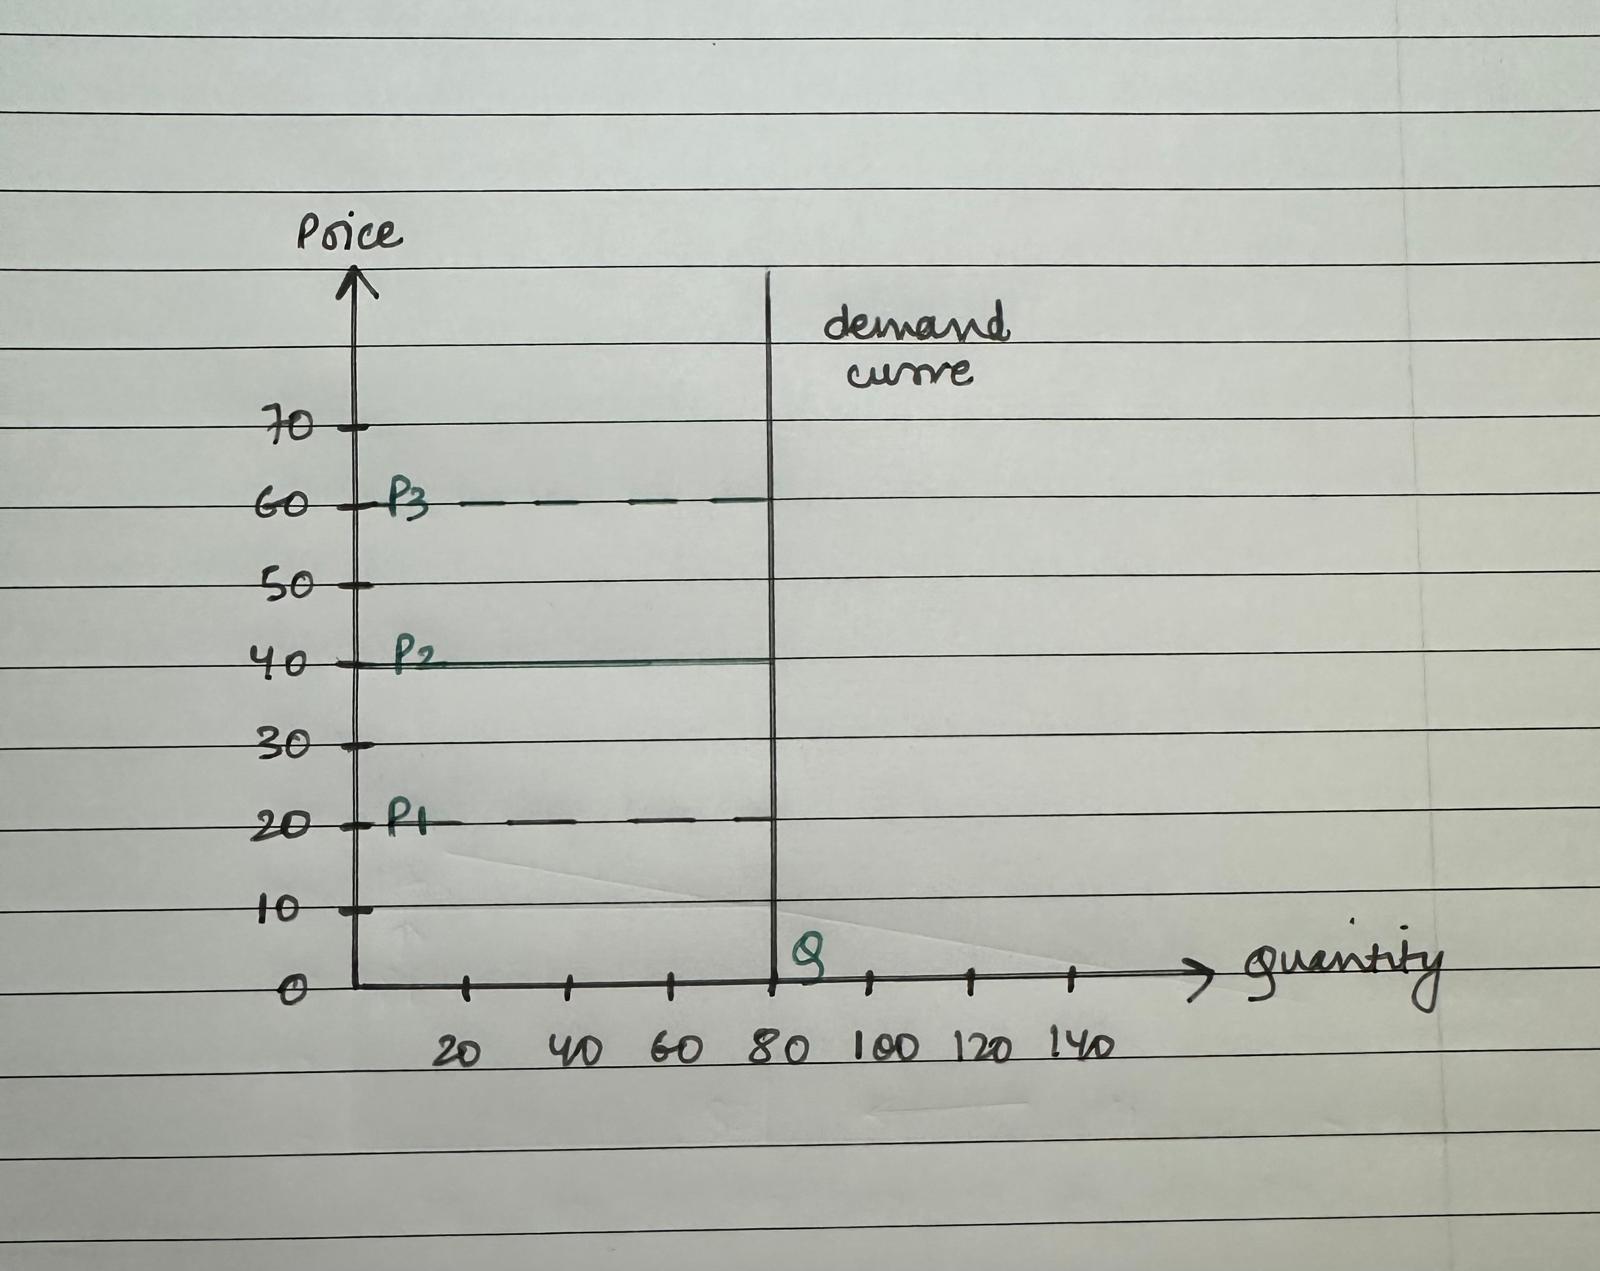
Factors Influencing Price Elasticity Of Demand
Availability Of Substitutes
- Influence: Products with numerous substitutes tend to have more elastic demand, as consumers can easily switch if prices rise.
- Examples: Butter versus margarine.
Necessity VS Luxury
- Influence: Essential goods generally exhibit inelastic demand since they are crucial for consumers, while luxury items show elastic demand as they are non-essential.
- Examples: Insulin for diabetics (necessity) vs. high-end electronics (luxury).
Proportion Of Income
- Influence: Products that consume a significant portion of a consumer’s income usually have more elastic demand.
- Examples: Major appliances versus inexpensive everyday items.
Time Horizon
- Influence: Demand elasticity can vary over time. In the short term, consumers might not change their purchasing behaviour significantly, but in the long term, they may adjust their habits as alternatives become available.
- Examples: Buying flight ticket due to an emergency versus buying a flight ticket in advance for a holiday
Brand Loyalty
- Influence: Strong brand loyalty can make demand more inelastic, as dedicated consumers may be less sensitive to price increases for their preferred brands.
- Examples: Premium brands like Apple or Rolex.
Implications For Businesses & Policymakers
Pricing Strategies
Businesses use PED to optimize pricing strategies. For products with elastic demand, reducing prices might boost sales volume and total revenue. Conversely, for inelastic products, increasing prices can raise revenue without significantly affecting sales volume.
Taxation & Subsidies
Policymakers consider PED when designing taxes and subsidies. Taxes on inelastic goods, such as cigarettes, may not significantly reduce consumption but can generate substantial revenue. Subsidies on essential goods help make them more affordable and can support sustained demand.
Market Decisions
Understanding PED helps businesses with product pricing, marketing strategies, and inventory management by predicting how changes in price will affect consumer behaviour.
Implications For Financial & Stock Markets
Impact On Company Earnings & Stock Prices
- Revenue Forecasting
PED assists investors and analysts in forecasting a company’s revenue based on price changes. Firms with inelastic demand may experience stable revenue with price increases, while those with elastic demand might see increased sales volumes with lower prices. - Profit Margins
Companies with inelastic demand can adjust prices to protect or enhance profit margins. In contrast, firms with elastic demand might face tighter margins if they need to reduce prices to maintain sales. - Stock Valuation
Investors may view companies with inelastic demand as more stable, potentially leading to higher stock valuations. Conversely, companies with elastic demand might be perceived as riskier due to revenue fluctuations. - Pricing Power
Pricing power is a key indicator of a company’s strength and profitability in the market. Firms with high pricing power can better withstand inflation, changes in input costs, or competitive pressures, as they have the flexibility to adjust prices to protect margins. It refers to a company’s ability to raise prices without significantly reducing the demand for its products or services. Companies with strong pricing power can increase prices while maintaining profitability because their customers are willing to pay more without switching to competitors or reducing consumption i.e., the company has a more inelastic demand curve.
For example, PED can help an investor understand the impact of change in price in the quantity demanded for an Airline company versus a pharmaceutical company. Since Pharmaceutical products are more necessary compared to an airline ticket, the Airline company has a more elastic demand compared to a pharmaceutical company. As a result, a change in price in an airline company will impact its revenue more than a pharmaceutical company.
Market Reactions To Economic Changes
- Economic Downturns
During recessions, companies offering inelastic products are generally less affected by reduced consumer spending, making their stocks more attractive during economic uncertainty. - Inflation
In inflationary periods, firms with inelastic demand can pass on higher costs with little impact on sales volume, preserving profitability. Companies with elastic demand might face reduced sales as consumers cut back spending.
For example, if we compare a luxury handbag versus milk, hand bag is a luxury item and has a more elastic demand curve compared to milk which is a necessity with a more elastic demand curve. During inflation or recession, consumers will consume milk irrespective of the change in price of the good due to the nature of the product versus consumers may choose to delay or not purchase a handbag because it becomes more of a luxury commodity in such situations.
Investment Strategies & Market Trends
- Sector Performance
Knowledge of PED aids in assessing sector performance. Sectors with inelastic demand, such as consumer staples, often perform better during economic fluctuations compared to discretionary sectors with elastic demand. - Mergers & Acquisitions
Companies with inelastic demand are often attractive acquisition targets due to their stable revenue streams, potentially impacting stock prices and market dynamics.
Regulatory & Policy Impacts:
- Regulatory Changes
Regulations that impact prices affect companies differently based on their PED. Firms with inelastic demand may absorb or pass on regulatory costs with less effect on demand, influencing market reactions. - Subsidies
Government subsidies for essential goods can benefit companies with inelastic demand by maintaining or increasing sales volumes, positively affecting their financial performance and stock valuations.
For example, suppose government provides subsidies to the housing market versus essential medical goods, the consumers will increase their demand more in the housing market since it will become more affordable for the consumers. On the other hand, just because the medical goods become less expensive, consumers will not start purchasing or consuming more medicines due to the subsidy.
Conclusion
Price elasticity of demand is an essential economic concept that helps in understanding consumer behaviour and market dynamics. By grasping PED, businesses can make informed pricing decisions, and policymakers can craft effective policies. Furthermore, PED has significant implications for financial and stock markets, affecting company valuations, investment strategies, and market responses to economic conditions. A thorough understanding of PED provides valuable insights for navigating both consumer and financial markets effectively.
Related Posts On The SimTrade Blog
Useful Resources
Case Study: The Effect of Price Elasticity on Revenue – Starbucks
Case Study: Price Elasticity and Tobacco Products
Case Study: Elasticity of Demand for Luxury Goods
About The Author
The article was written in October 2024 by Anant JAIN (ESSEC Business School, Grande Ecole Program – Master in Management, 2019-2022).
▶ Read all articles by Anant JAIN.